
Optimizing Visuals to Boost Automotive Ads Performance


Buying a car is one of the biggest investments someone will make in their life. As with all complex decisions, it requires a lot of research, thinking, and planning on behalf of the consumer to define your brand as the best choice.
The purchase journey in automotive requires multiple consumer interactions through digital touchpoints: car buyers visit 4.2 websites on average (1), and consume 11.4 pieces of online content (2) before walking into a dealership. On top of that, the rapid growth electric vehicle in light vehicle sales (3) is a new challenge automotive marketers have to face: What are the most efficient editorially and visually communications to engage on electric cars?
Simply put, buying a car isn’t the same as it used to be. In response, auto brands need to fully embrace a digital strategy in order to continue to reach and engage potential customers. Online advertising is not only key to bringing in these leads, but also driving consideration to move consumers through the marketing funnel.
Standing Out from the Crowd
Standing out in purchase funnels saturated with content is a challenge for automotive brands.
A team of neuroscientists from MIT has discovered that the human brain processes entire images seen by the eye in as little as 13 milliseconds (4): Brands have a fraction of a second to capture the attention of their audiences.
Aware of these challenges, Outbrain partnered with TheContillery visual analytics platform to provide data-driven insights for a successful recommendation campaign using creative best practices and the most impacting visuals.
Improving Performance with the Right Images
The performance of visuals shows extremely high disparities in performance: Best performing visuals generate 2 to 3 times more performance than low performing ones.
What is the secret of these high-performing visuals? What are the creative choices that are optimizing and conversely damaging the performance of automotive ad campaigns?
This is the question asked and answered by the research presented in our white paper “Global Insights to Speed Up Your Digital Campaign Results”.
Indeed, the new possibilities offered by Artificial Intelligence are changing conventional wisdom, which had assumed that creativity could not be modelized, evaluated, or learned.
By getting a systematic and in-depth understanding of creative contents, computer-vision technology allows us to systematically describe image attributes on each automotive visual: car type, type of scene, background, vehicle display and framing, the color of the car, contrasts, depth, car body reflection, presence of people, car dynamics, etc.
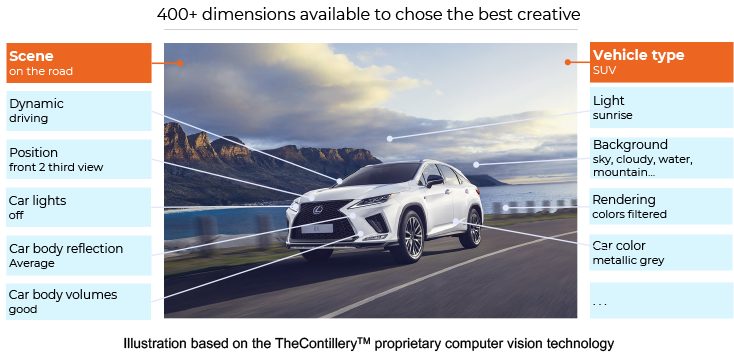
Fig 1: Describing image visual cues thanks to artificial intelligence
By applying these image descriptors on thousands of automotive campaigns, Outbrain and TheContillery uncovered visual attributes that are positively and negatively influencing ads performance. Getting insights, for a car type, on what car color, background, type of scene, framing, etc. is over or underperforming is now possible and available.
How Selecting the Best Visuals Impacts Performance
TheContillery has identified more than 30 varied themes – or visual storytelling – used by automotive brands to advertise their car models. Out of these creative options, the top 85% of automotive campaigns are using one of the top themes presented below.

Fig 2: Most used visual themes used, as a % of ads
Making proper creative choices amongst these available themes has a huge impact on campaigns performance. As shown in figure 3 we see extremely high disparities in performance among the visual themes. On average across countries, the top-performing image themes deliver 2 to 3-times higher CTRs than the least performing themes.

Fig 3: Scene type performance vs. average country performance in %
One Size Does Not Fit All
The visual content selection must also suit countries’ usages. Some characteristics can be beneficial to a high-performing campaign in one country and detrimental to another.
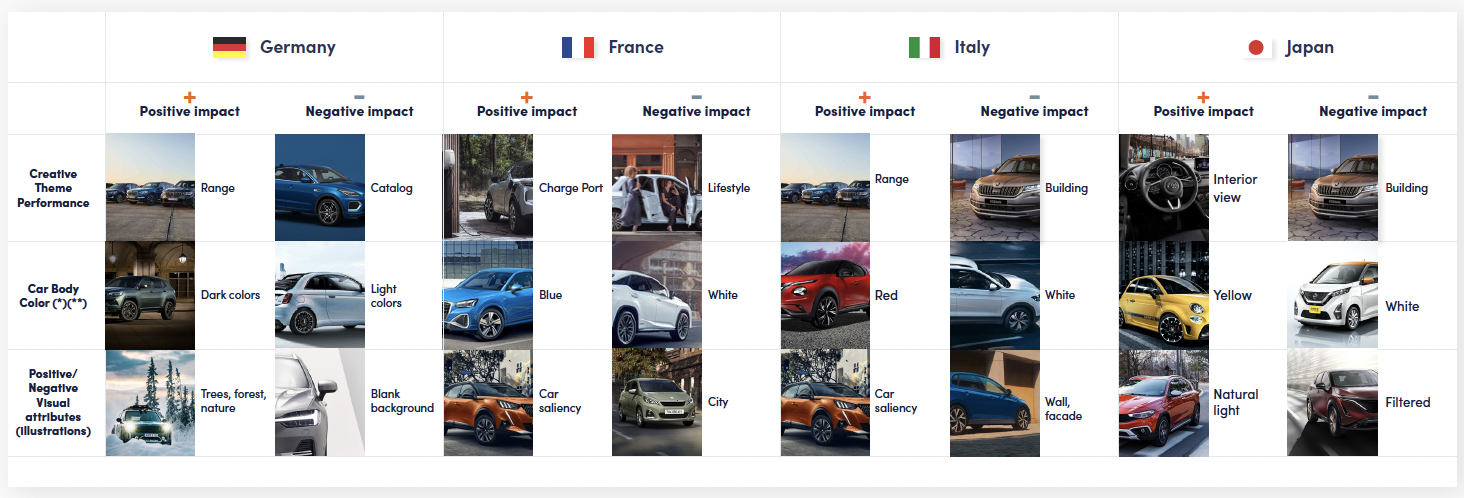
Fig 4: illustration of geographical specificities in visuals performance
(*): This general statement can be adjusted when retaining specific creative options specifically adapted or unadapted to the color of the car. (**): Non mentioned colors have a neutral or balanced impact.
Results show that both in Germany and Italy “range” is a performing creative theme, while “charge port” is the top performer in France.
When it comes to choosing the car color, prefer dark colors in Germany, blue in France, and red in Italy.
Similarly, visual performance might vary by vehicle type. Making a good association of models and themes is a key step to optimizing campaign performance.
The chart below illustrates relative performance by theme for electric and hybrid vehicles. Interestingly, the most used category – charge port – is performing below average. This result is not inevitable and our research finds out how to outperform electric vehicles campaigns by making the proper creative choices for the “charge port” theme.

Fig 5: Visual performance by theme on electrified vehicles
A Huge Impact on Campaign Performance
Depending on your current situation, selecting the best visuals and creative execution can impact the performance of your ad campaigns by +30 to +50%, and sometimes even more.
Want more clues about how imagery can drive better engagement in the automotive industry? Feel free to download our latest white paper or contact us to get more information on a particular area or request a demo.
References:
(1) Cox Automotive, Car Buyer Journey, April 2019.
(2) Forrester, Marketing And Media Efficiency Outcomes Drive Content Marketing, 2015.
(3) According to S&P Global, electrification remains the industry’s pivotal challenge over the next five years, with Europe and China aiming for 20% of light-vehicle sales to be electric vehicles by 2025.
(4) “In the blink of an eye”, MIT News Office, January 2014.