Keeping Track: An Introduction to Using Google Analytics with Outbrain Amplify

Congratulations! You’ve launched your Outbrain campaign.
You’ve checked off all those “best practice” boxes. You’ve whipped up a winning combination of headlines and images and implemented the Outbrain conversion pixel (if that is your campaign goal).
Working with 3rd party analytics tracking can be one of the most important components when optimizing your campaign towards success. It supplies you with important audience engagement information to help inform any and all adjustments you make on your campaign. When paired with the data available through the Amplify dashboard, you’ll be able gain a 360 degree perspective of how your campaign is performing.
In this article, I will focus specifically on Google Analytics but feel free to apply these practices to whichever platform you’re opting to work with.
First things, first: the tracking code. We recommend using the following code in all owned media campaigns you launch with us:
utm_medium=discovery&utm_source=outbrain&utm_content={{ad_title}}&utm_campaign=[Your_campaign_name]&utm_term={{section_name}}
The UTM string should be implemented under the Tracking section of Campaign Settings and we’ll automatically append it to every URL uploaded to the campaign. Just be sure to swap out [your campaign name] with the name of your Outbrain campaign.

If you want to see what your link will look like with the UTM tracking added, simply enter a link into the second field. We’ll generate what the full URL looks like below.
Now, how do you choose from Google Analytics’ infinite abyss what data to prioritize? And more importantly, what do you do with that data once you have it?
Luckily, we’ve created templates for you.
They will allow you to monitor all the relevant data in one place. There are two options — you’ll want to use the one that aligns best with your goal. If you’re looking to drive conversions (purchases, subscriptions, or lead generation) you’ll want to use this template. If you’re optimizing for engagement (page views or time spent on page) you’ll want to download this template.
Depending on your goal, you should place different values on different analytics. If you’re optimizing for conversions, you’ll want to create at least one goal, which is GA’s version of conversion tracking. If you’re unfamiliar with this process, you can head here for quick tutorial from Google. This dashboard will help you identify what is working and what is not working goal-wise.
If your campaign goal is engagement, you’ll notice we place the emphasis on time spent on page, pages per session and bounce rate. Beware at how you’re looking at these metrics though. I recommend checking out our blog post on bounce rate for some context on how you’ll want to be using this metric.
The dashboards are structured as a hierarchy of data.
The first column, regardless of the goal you’ve selected, will show you high-level analytics. It provides a visual on Outbrain traffic volumes but also lends some insight into how the traffic if performing.
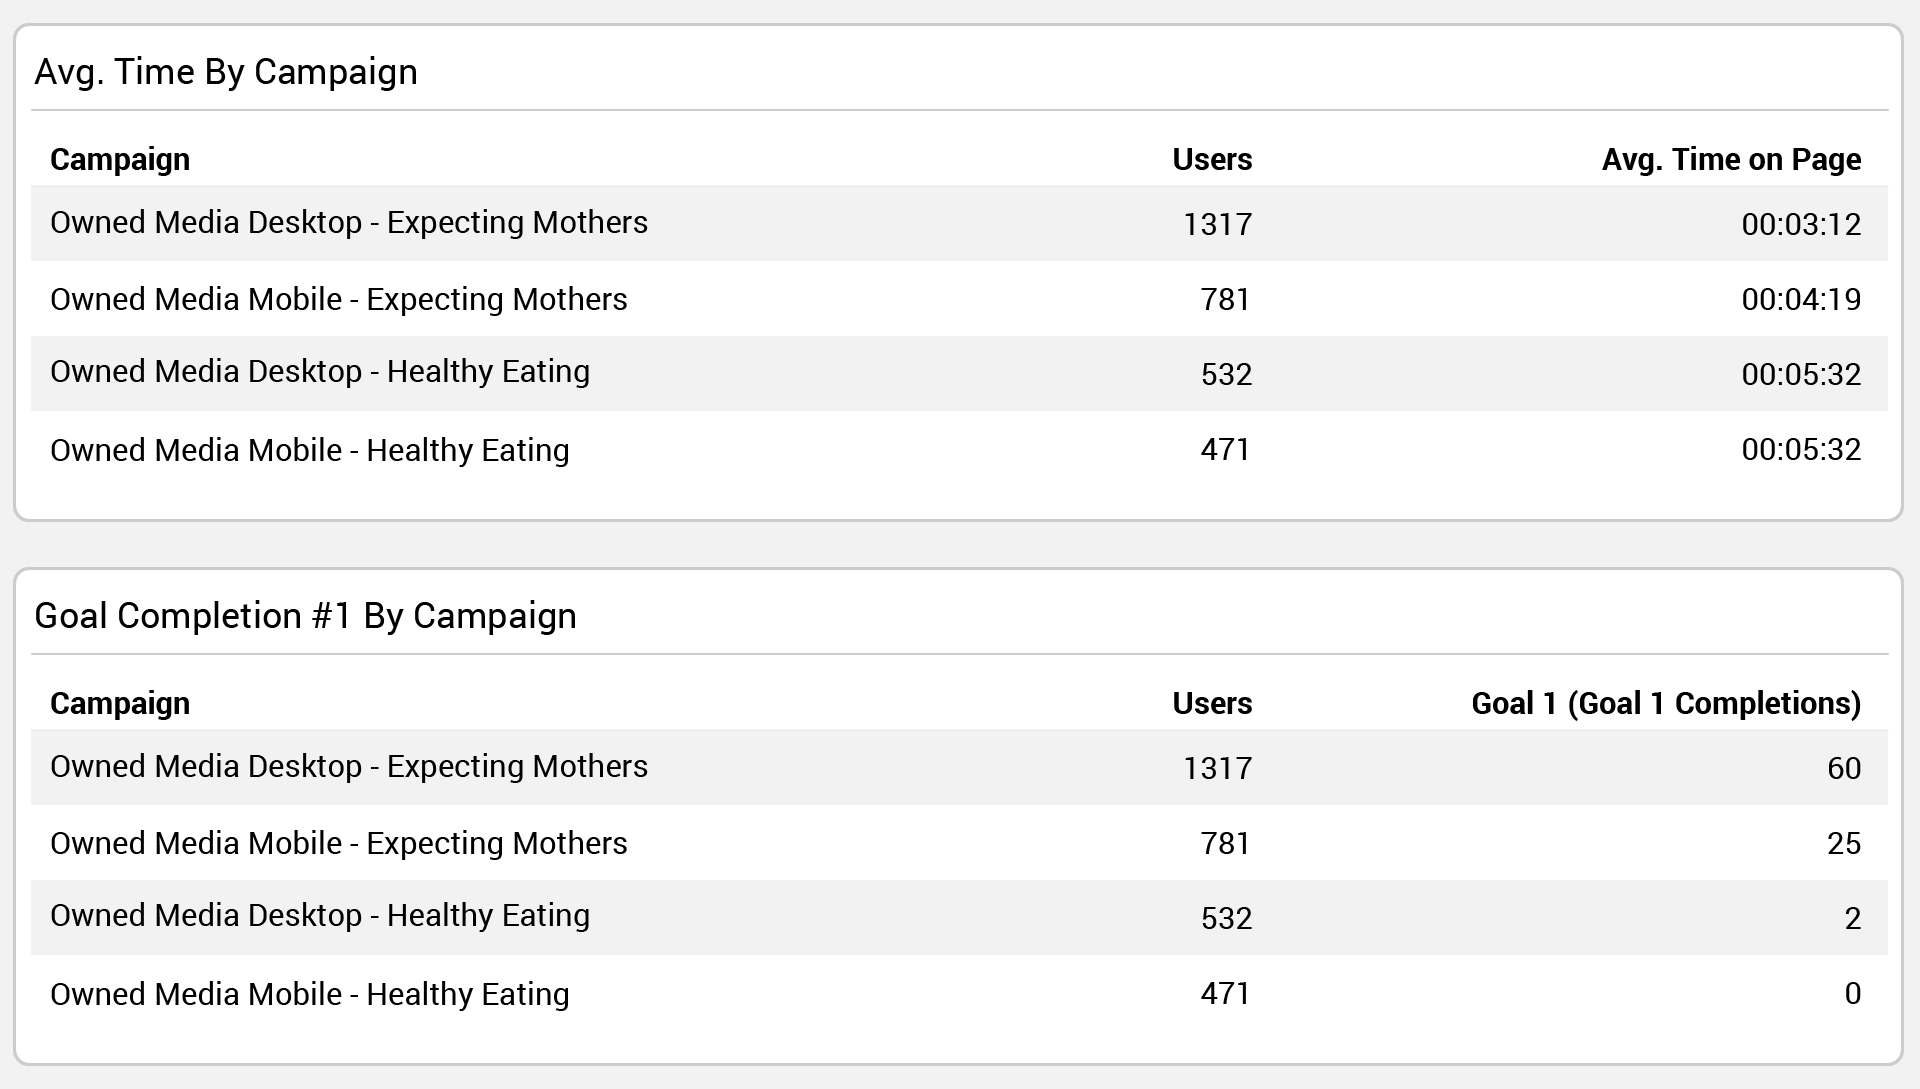
As we move across columns you’ll see the data drill down to the campaign level showing you how each campaign is performing both engagement-wise and conversion-wise. Is there a particular campaign that is outshining the rest? You may want to consider putting more resources behind it.

Next you’ll be able to see performance by traffic source. This will allow you to make specific choices based on engagement levels in the traffic brought in by each publisher section. The source names you see here will correlate with the ones you see populated in “By Section” under the Campaigns tab in your Amplify dashboard.
Note that we do not recommend blocking sources before they’ve received at least 300-400 clicks. You’ll want to ensure there is enough data from the source before assessing performance. Removing sources too early and too often can lead to over-blocking which can detrimentally affect your campaign.
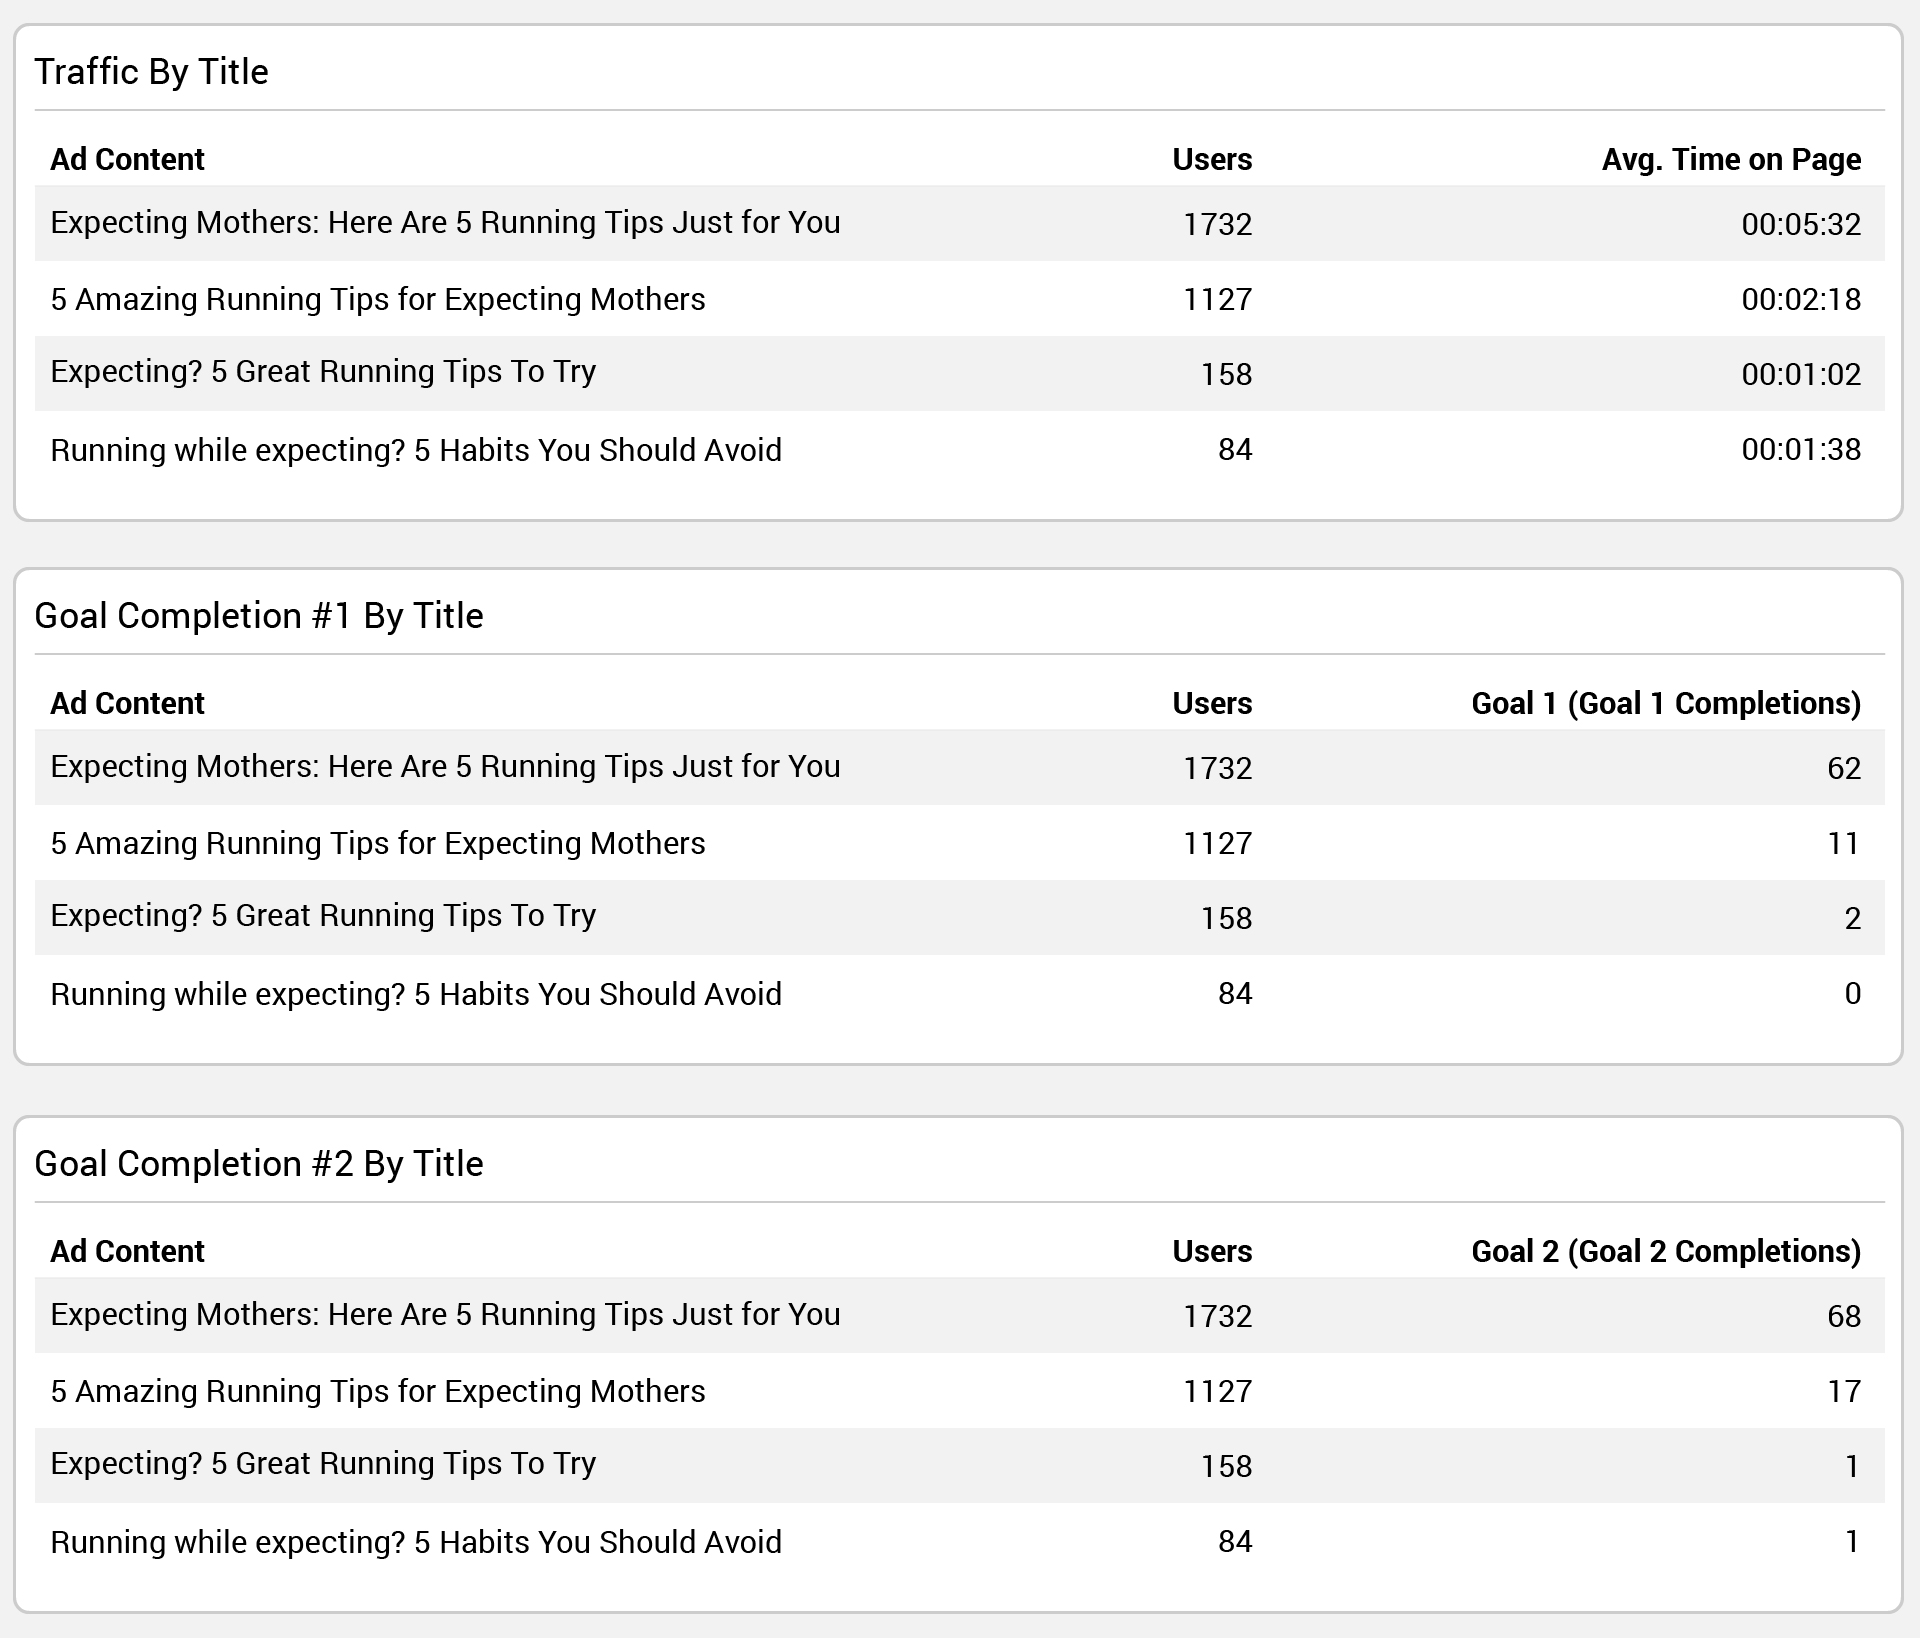
Finally, we drill down to the headline-level. This section complements the “By Content” view under the Campaigns tab in your Amplify dashboard. How are the headlines you’re working with performing? This information should help inform future creative choices. Take note of the keywords and phrases in the top performing headlines as you’ll want to work these into future headlines. Additionally, you’ll also want to consider pausing headlines that are driving high volumes of traffic with a low ROI.

And finally…
These dashboards should serve as the optimization guideposts for your Outbrain campaigns. Not only that, but they also serve to provide increased insight into the attributes that are both hurting and serving your Outbrain efforts. Just be careful not to make decisions too soon. You’ll want to ensure that you’ve gathered enough data before deciding whether something is working or not. And if you’re ever in doubt, you can always consult your AM or our success team at support@outbrain.com.


