
New! More Publisher Insights Launched in the Outbrain Dashboard

We recently highlighted new additions to our publisher dashboard as part of our longtime commitment to providing tools that allow publishers to maximize RPMs, grow total revenue, and maintain editorial control.
Well, we are back again and excited to announce the launch of even more new features and reports – this time, specifically designed to provide publishers with deeper insights into audience interaction rates with both their editorial content and their widget optimizations.
Let’s take a closer look:
Organic Content Report
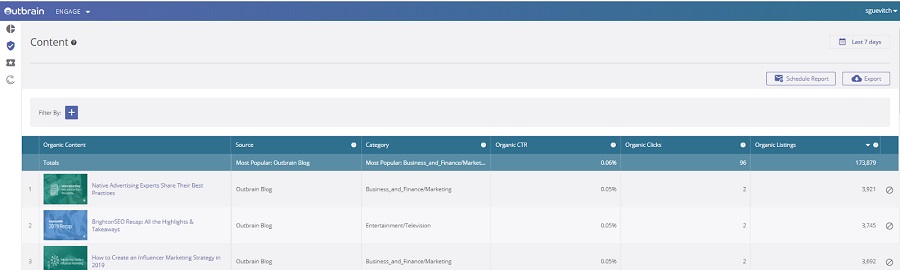
This feature can be found in the Editorial Controls option within the dashboard. The insights in this report enable you to analyze the interaction rates with editorial content pieces that are served via Outbrain placements on your site.
Insights in this report can be used to inform your content creation strategies and observe which headlines, images and content categories are driving higher interaction rates. You could also consider informing your social media strategy by identifying articles that are more likely to generate user click-throughs based on their performance within onsite recommendation units.
The report displays the organic content source (in which section of your site the article was originally published), CTR, volume of clicks, and number of times the recommendation appeared in the Outbrain widget (listings). Content can also be easily filtered to no longer appear as part of the organic recommendations appearing within your Outbrain placements.
Optimization Report
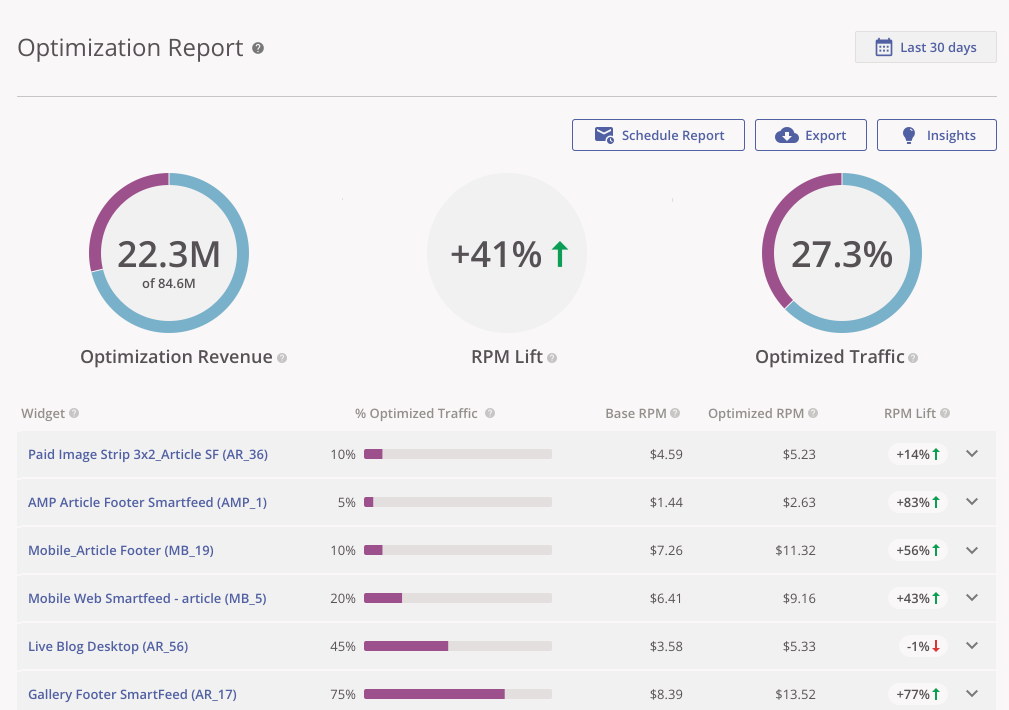
Our partners are regularly unlocking higher engagement rates and commercial returns from their Outbrain placements by utilizing our optimization engine. This always-on approach to optimization dynamically tests enhanced widget layouts for the highest CTR and RPMs.
Now with the launch of the Optimization Report, our partners are able to observe the optimization results for widgets and Smartfeeds which are enabled for the optimization engine.
Key features include:
- Observe total impact with aggregate level data points.
- Drill down into specific widget performance with the grid view.
- Estimate the potential uplifts that extending tests further could generate using the insights feature.
This report is a useful tool to track results as well as shape recommendations for further testing.
The newly launched Optimization report can be found under the “Reports” menu within the Engage Dashboard.
We hope you find these new insight tools valuable to inform your editorial strategies and better understand user behavior signals across your sites.
As always we have a lot more coming up for our Engage dashboard, be sure to check back regularly to see what’s next!