
New Publisher Insights Features Now Available in Outbrain’s Engage Dashboard!


Here at Outbrain, we are committed to being full-service partners, helping publishers achieve the highest and best RPMs, grow total revenue, and utilize our data to provide the best insights for their businesses. As part of this commitment, we’ve released two exciting new features to the Dashboard – the Historical Data Timeline and Group Level Reporting!
Both of these features are aimed at providing insights that can be used to inform revenue and editorial decisions.
We continuously strive to meet the needs of our publishers, so keep an eye out for new Dashboard improvements to come. In the meantime, check out the Historical Data Timeline and Group Level Reporting features below!
Historical Data Timeline
As data regulations increase, publishers are always looking for alternate solutions to third-party data to make informed decisions about their businesses. Our publishers are able to do just that with the new Historical Data Timeline.
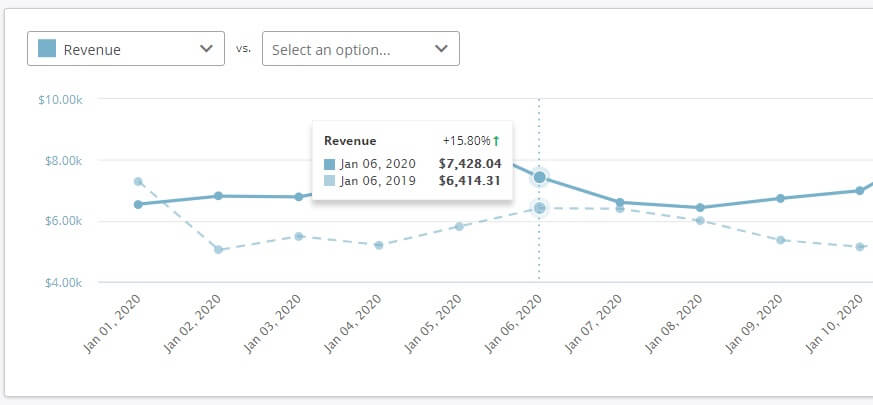
The Historical Data Timeline can be used to easily view selected performance metrics and compare either to the previous period selected or the same time period in the previous year. This is a useful aid in monitoring performance metrics over time to conduct analysis and extract insights.
This feature can be found within Performance Reports and displays performance data in both graph and grid form. In the graph view, hovering over a line will show the user the current and historic data point, alongside a % increase/decrease. A dashed line will represent the previous period while a solid line will represent the current one, allowing for easy visual comparisons.
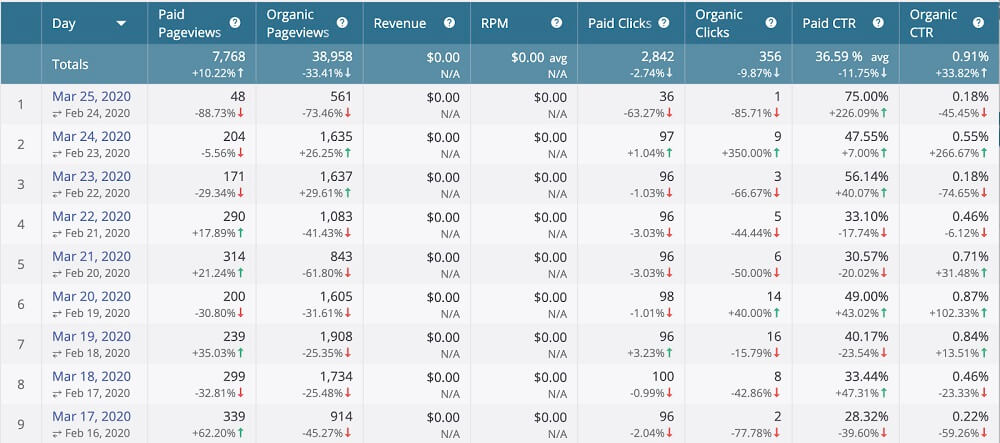
In the grid view, a % increase/decrease and a green or red directional arrow will aid users in easily viewing which data points are up or down vs the comparative period.
Group Level Reporting
This feature can be found within the Dashboard under the Performance Reports section. Group Level Reports reflect aggregated data from across a publisher group and give publishers the ability to choose multiple individual sites that can be aggregated together within the report.
This report is a valuable tool to increase efficiency, enabling our partners to see a range of metrics across their entire portfolio within a single view, whilst maintaining the ability to view single site data points. Save time and energy by utilizing the Schedule Report, which is also available at the group level.
Within the report, data in both graph and grid views provide insights into a variety of metrics like RPM, CTR, Pageviews, and more, for both organic and paid, to compare over a selected period of time.
That’s it for now, folks! Be sure to head on over to the Engage Dashboard and start taking advantage of these exciting new insights! As always, we hope you find these tools useful in informing your editorial and revenue decision making and gaining deeper insights into audience behavior.
Remember, we’re here to help! Feel free to reach out to publishersupport@outbrain.com with any questions.