
One of the biggest challenges facing infrastructure groups is how to build TRUST with their customers. If achieved, this trust will lead to a better working environment where colleagues have good relationships and trust each other.
And like any relationship, one of the ways to gain someone’s trust is by being transparent. Transparency shows that you have nothing to hide, and allowing the free flow of information between sides.
In our engineering context, we are talking about transparency of the micro services owned by development teams and the resources that the infrastructure groups provide them.
Providing transparency for the resources’ usage is a difficult feat even in a simple system. It is even more complex when resources are shared across development teams, since you need to show each team its own relevant usage and not the overall usage of the whole physical resource.
At Outbrain we advocate for a full responsibility model – each development team has full ownership of its services, from development to production. This model gives the teams lots of power, as they have full freedom and are independent to do their job (and they do it great!) without having the infrastructure teams as a bottleneck.
This model makes the need for transparency of resources (and especially shared resources) even more critical.
A Bit Of Nostalgia
In the past everything was simpler. I grew up in the Eighties (actually it was the Seventies but we don’t have to be accurate all the time), we were young and beautiful, and everything was great and simple – there was no Internet, no mobile phones and we played outside in the street with other real human beings.
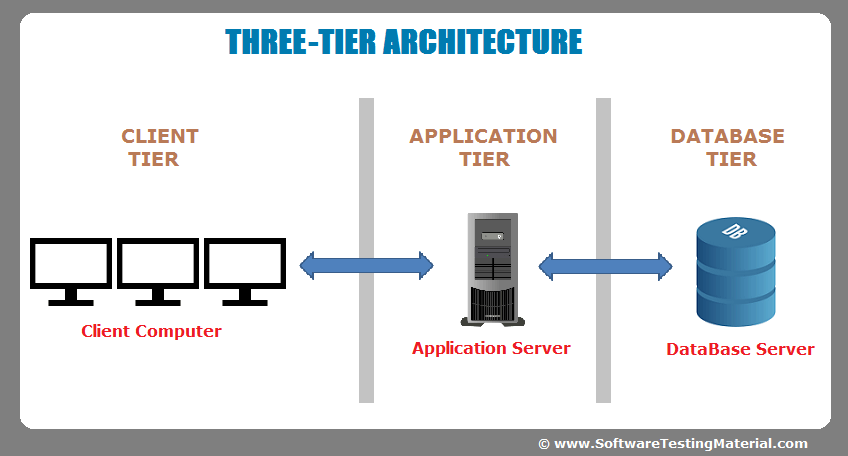
Even the computer systems were simpler. We had the classic 3 Tier Architecture: Presentation, Application & Data layers. The Application layer was a big monolithic server and the Data layer was probably an Oracle RDBMS. The infrastructure teams had full control over all the systems – no changes were made in production, unless they were the ones making it.
Back To Reality
The Eighties are gone, we are not children anymore (but still beautiful…). On the tech side, the micro services architecture was introduced, the big monolithic servers were broken into many little micro services, and the big databases followed the same trend. Each micro service can have its own database as if that wasn’t complex enough, each micro service can even have a different type of database depending on its own specific use case.
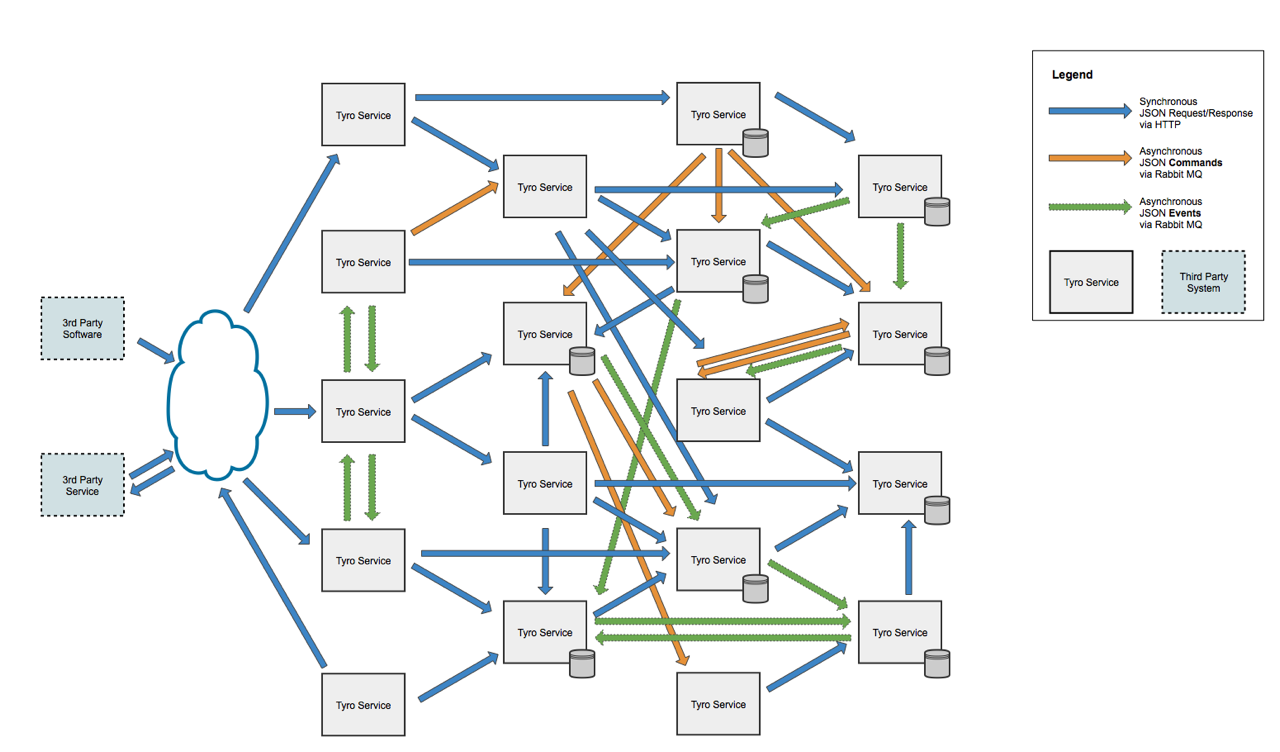
In addition, the amount of data and traffic grew exponentially, and the term BigData was invented. In order to support its growth, the systems become more and more complex, and in some cases the architecture became so complex and dynamic that no single person can describe it, not to mention to map it in a flow chart.…
The Challenge
Outbrain is the world’s leading content discovery platform. We serve over 300 billion content recommendations every month, to over 800 million users across the world. In order to support such a large scale, we have a backend system running hundreds of micro services on top of an infrastructure that is spread over more than 6000 physical machines spread between 3 data centers and in public clouds (GCP & AWS).
Our infrastructure contains, among other things, many data store clusters, data processing systems, data delivery pipelines and a BigData lake that is used by our recommendation ML algorithms, BI Engineers and analysts to produce business reports, etc.
And yes, the Cloud Platform Group which is responsible for supplying all this infrastructure has the same challenge that was described in the beginning – how do we empower our users and provide them the transparency to how much resources they are using and for what.
Conflicts
As complex as these computer systems are, the real complexity is actually the human factor. Every company has conflicts of two types: personal and structural.
As everyone knows, personal conflicts will always complicate engineering challenges. While structural conflicts are between technical teams with different roadmaps, priorities and constraints. They can quickly lead to personal conflicts and to a work environment with lots of tensions and frustrations. Such an atmosphere will inevitably affect the quality of the computer systems …

In our case the structural conflict is between the R&D teams and the Infrastructure teams. For example, infrastructure teams often feel like they are treated like warehouse workers. The R&D teams come with capacity or feature demands and the Infrastructure teams must fulfils them, the R&D teams are not aware or concerned of the effects and costs of their requests or the effect it might have on the resource which is shared with other teams.
Structural conflicts will always exist, but they can be managed effectively as long as there is a relationship built between the teams.
The Solution
The base of each relationship is TRUST and in our case the base for that is to provide visibility of all used services and resources.

The visibility enables the infrastructure teams to know who is using the infrastructure and how it is being used. The same visibility helps the R&D teams to understand the capacity of infrastructure that they are using. In fact, by providing this visibility we empower the R&D teams and taking the Infrastructure teams out of the warehouse worker role.
We realized that we must find a solution, a single place that will enable us and our users to understand the footprint of the various resources that are used and for what purposes. This will also enable us to estimate the cost of each feature/project leveraging our knowledge of resources that are used by it.
At Outbrain we created a self-serve Usage Report system, which crawls our entire infrastructure and provides visibility and transparency of resources for everyone, in order to display the required dashboards and reports.
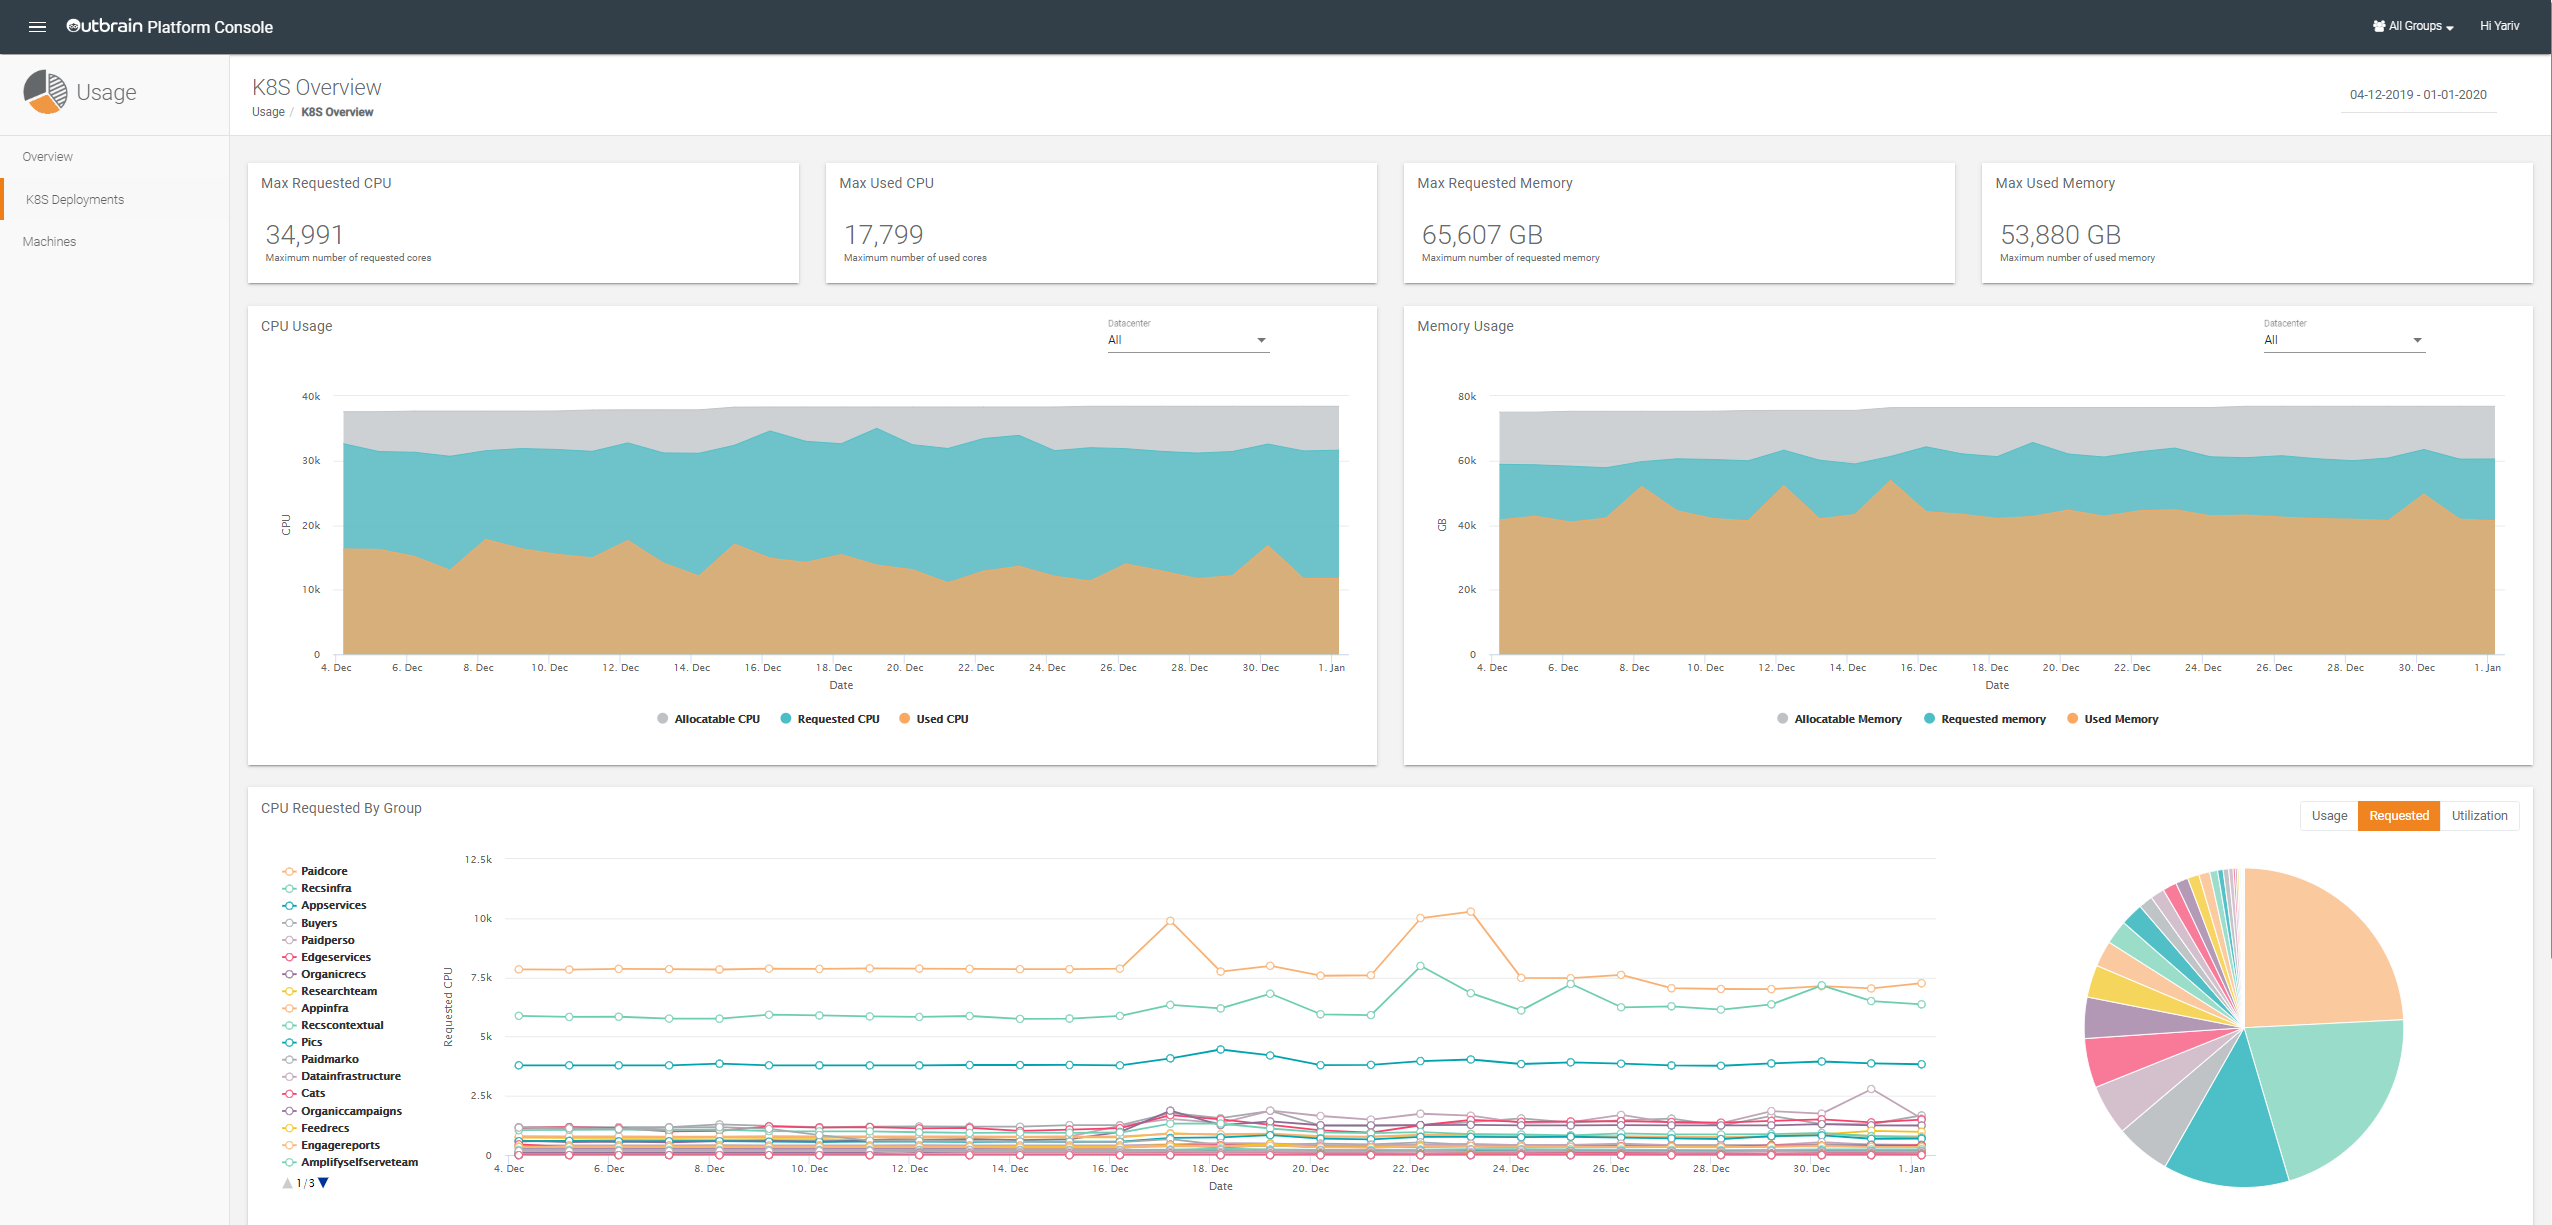
There are lots of resources that can be monitored by the Usage Report system, but we decided to focus on the following:
- Micro services deployments
- Physical machines
- Public cloud resources
- Data processing utilization
- Storage
- Network usage
As you might imagine, the most challenging part of the Usage Report system is the crawling process, which needs to correlate between all the services and their users. This is done by adding an “owner” label to the services so it can be used later. Whereas the Usage Report system had to support different types of labels, based on the capability of each resource.
Conclusions
While not all services are part of the Usage Report system yet, we have already started to see the benefits of this tool.
In the process of implementing this tool, we added additional metadata which identifies the resource usage for each development team. Now we can associate the usage for each team.
In addition, by having this visibility we can estimate the cost of a certain feature. This can be achieved by calculating the cost of all the resources that it uses; in that way we can know if a feature is ROI positive or not.
But the main benefit that we gain is the TRUST. Now we have a real time dashboard which enables everyone to understand their resources usage. This knowledge increases the trust between the R&D and Infrastructure teams and empowering everyone to be more efficient and to take our ownership model one step forward.
Director of Data Engineering @ Outbrain's Platform Group, developing large-scale data systems for Outbrain's content recommendations platform.