How do you manage resources and plan for future growth in a distributed, multi-tenant and ever-changing environment? In this blog post I will elaborate on the challenges we faced at Outbrain with managing our Hadoop clusters, and the service we created to improve visibility and transparency into the clusters’ utilization.

Outbrain generates a lot of data.
Every impression, click, and widget request is sent and made available for processing, along with many other business events. This amounts to tens of billions of new records being delivered each day into our Hadoop clusters, in two on-premise data centers, as well as in the cloud. These are multi-tenant clusters, with over a dozen distinct business entities running all kinds of workflows, using various data processing engines. We currently have a combined total of more than a thousand defined workflows, which in turn run a total of 10,000 jobs on each of our two main clusters every day. The workflows are always evolving, with dozens of commits each week. Data volumes also change constantly, usually upwards, as a result of traffic growth, new features being deployed or other production changes.
Most workflows start running when data for a certain period of time has fully arrived, be it hourly, daily or in some rare cases even weekly and monthly. And with everyone rushing at the same time to process the newly available data for their own uses, the cluster resources get depleted quickly. This is known as the Tragedy of the Commons, where each user tries to maximize its own benefits from the cluster, resulting in an overall slowdown. Since we don’t want jobs with tight SLAs to be slowed down by jobs with looser SLAs we schedule jobs using queues with different weights and capacities. This brings a third constantly changing variable into the picture: business priorities.
Take reporting vs. serving as an example, do we want our customers to have access to reports as soon as possible, but at the cost of our end-users not getting the best up-to-date recommendations, or vice-versa? This balancing act is a business decision and these decisions also change frequently, with different product features being given priority over others.
And so with ever-changing processing logic, data volumes as well as business priorities, it is our team’s job to provide continuous in-depth visibility as to how resources are being used, so that informed decisions about resource allocation can be made.
To solve this lack of visibility we created Jacko, a service that helps us collect runtime data available from various history servers and index it to Elasticsearch, allowing us to easily query and use Kibana dashboards and visualizations to analyze workflows’ behavior over time. Making this data accessible helps us estimate workloads, which can help evaluate costs for features across multiple workflows and plan for future growth. It can also be used for anomaly detection, so we can get alerts for all sorts of behavioral changes, from abnormal I/O usage to intermittent failures.
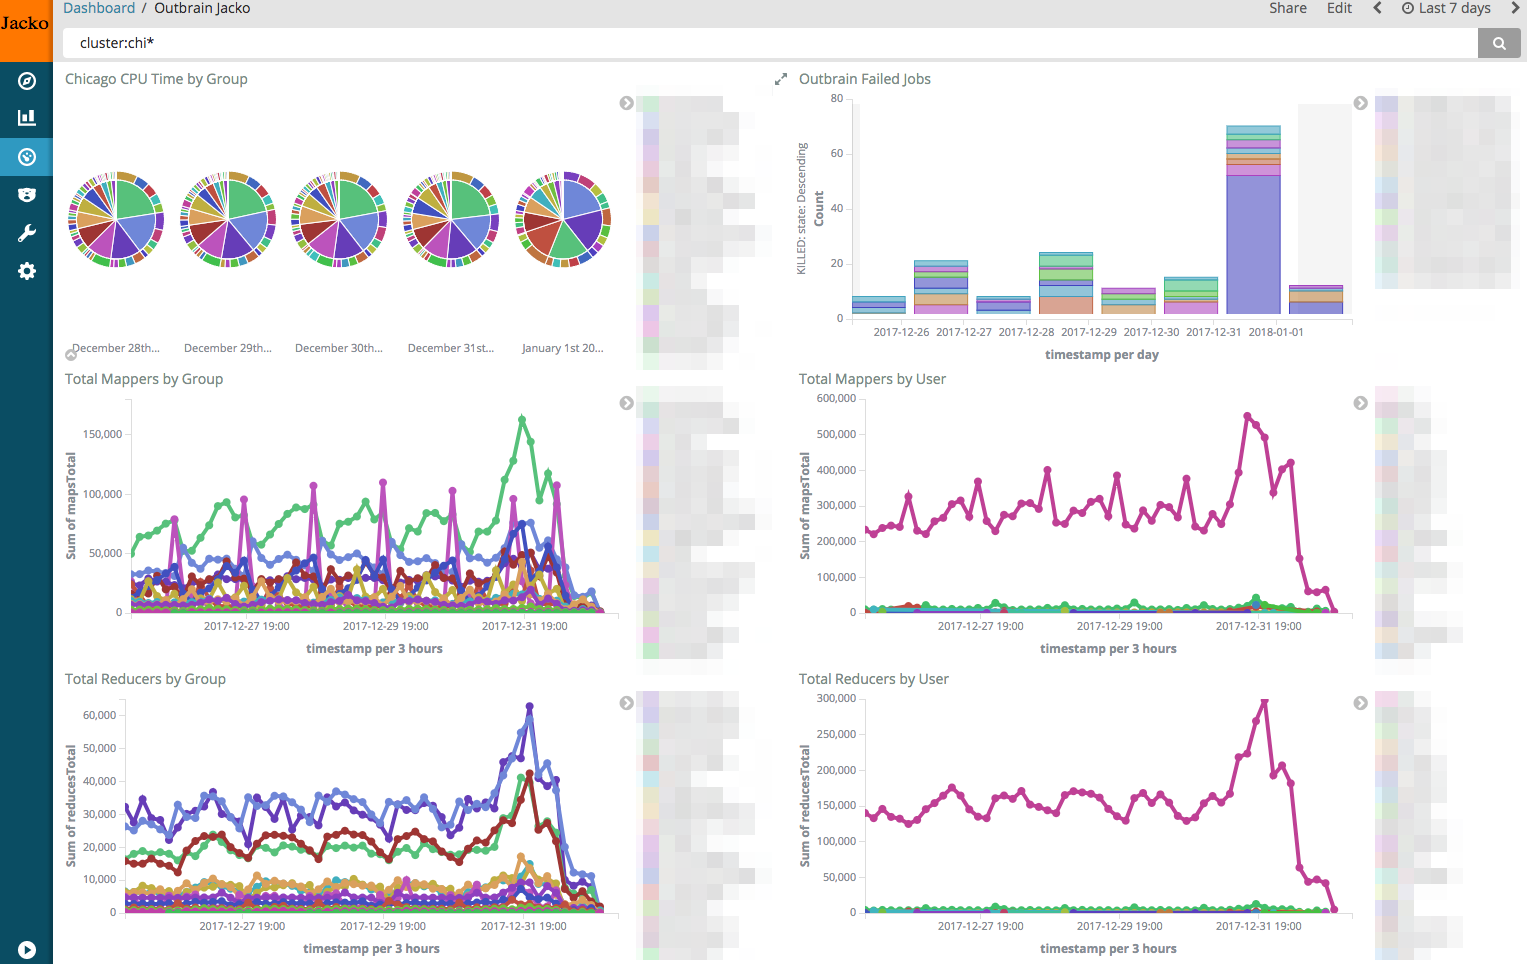 One aspect of workflow runtime data where adding visibility was crucial for us was resource consumption. When users run their workflows they normally check whether they succeed or fail, and perhaps know the total execution time, but they are usually unaware of the actual impact on the cluster. The execution time is not a good indicator for resource consumption – a job can run for hours while using only 1% of the cluster’s resources while another runs for a few minutes but takes up all of the cluster’s resources. Measuring the cluster’s machines’ CPU usage also doesn’t help, since a core might be idle but as long as it is assigned to a certain job it is unavailable to the cluster, so it is effectively fully used. To know the actual resource consumption we must know the total time each resource was assigned to any tasks related to a workflow. And with Jacko, our users can now easily drill down and compare the workloads of their workflows.
Using these new insights into the actual resource consumption profiles of the workflows, it was easy for us to identify the topmost resource-hogging workflows and focus our efforts on improving them. For example, we found a Hive query that was supposed to process a single partition but ended up going over the entire table due to predicates not being pushed down correctly. Problems of this kind are normally easy to fix but are hard for users to detect – processing is distributed, so the total execution time was not abnormal in this case. Overall, these improvement efforts made possible by Jacko helped us reduce the total resource consumption in our main Hadoop clusters by more than 30%, equalling hundreds of thousands of dollars worth of hardware upgrades, while making sure resource usage is aligned with business priorities.