Inside one of our data centers (tiny COVIDs by CDC on Unsplash)
If this title did not send a slight shiver down your spine, then you should either move on to the next post, or drop by our careers page – we’d love to have a chat.
This post will touch the core of what we do – building up through abstraction. It will demonstrate how design principles, like separation of concerns and inversion of control, manifest in the macro, physical realm, and how software helps bind it all together into a unified, ever developing, more reliable system.
While we’re only touching the tip of the iceberg, we intend to dive into the juicy details in future posts.
Who we are
We are a team of 4 penguins who enjoy writing code and tinkering with hardware. In our spare time, we are in charge of deploying, maintaining and operating a fleet of over 7000 physical servers running Linux, spread across 3 different DCs located in the US.
We also happen to do this 6,762 miles away, from the comfort of our very own cubicle, a short drive from the nearest beach resort overlooking the Mediterranean.

License to use: Creative Commons Zero – CC0.
Challenges of Scale
While it may make sense for a start-up to choose to start with hosting their infrastructure in a public cloud due to the relatively small initial investments, we at Outbrain choose to host our own servers. We do so because the ongoing costs of public cloud infrastructure far surpass the costs of running our own hardware in collocated data centers once a certain scale is reached, and it offers an unparalleled degree of control and fault recovery.
As we grow in scale, challenges are always a short distance away, and they usually come in droves. Managing a server’s life cycle must evolve to contain the rapid increase in the number of servers. Spreadsheet-native methods of managing server parts across data centers become, very quickly, cumbersome. Detecting, troubleshooting and resolving failures, while maintaining reasonable SLAs, becomes an act of juggling vastly diverse hardware arrays, different loads, timing of updates and the rest of the lovely things no one wants to care about.
Master your Domains
To solve many of these challenges, we’ve broken down a server’s life cycle at Outbrain into its primary components, and we called them domains. For instance, one domain encompasses hardware demand, another the logistics surrounding inventory lifecycle, while a third is communication with the staff onsite. There is another one concerning hardware observability, but we won’t go into all of them at this time. The purpose of this is to examine and define the domains, so they can be abstracted away through code. Once a working abstraction is developed, it is translated into a manual process that is deployed, tested and improved, as a preparation for a coded algorithm. Finally, a domain is set up to integrate with other domains via APIs, forming a coherent, dynamic, and ever evolving hardware life cycle system that is deployable, testable and observable. Like all of our other production systems.
Adopting this approach has allowed us to tackle many challenges the right way – by building tools and automations.
The Demand Domain
While emails and spreadsheets were an acceptable way to handle demand in the early days, they were no longer sustainable as the number of servers and volume of incoming hardware requests reached a certain point. In order to better organize and prioritize incoming requests in an environment of rapid expansion, we had to rely on a ticketing system that was:
- Could be customised to present only relevant fields (simple)
- Exposed APIs (extendable)
- Familiar to the team (sane)
- Integrated with our existing workflows (unified)
Since we used JIRA to manage our sprints and internal tasks, we decided to create another project that would help our clients submit tickets and monitor their progress. Relying on JIRA for both incoming requests and internal task management, allowed us to set up a consolidated Kanban board that gave us a unified view. Our internal customers, on the other hand, had a view that presented only hardware request tickets, without exposing “less relevant details” of additional tasks within the team (such as enhancing tools, bug fixing and writing this blog post).
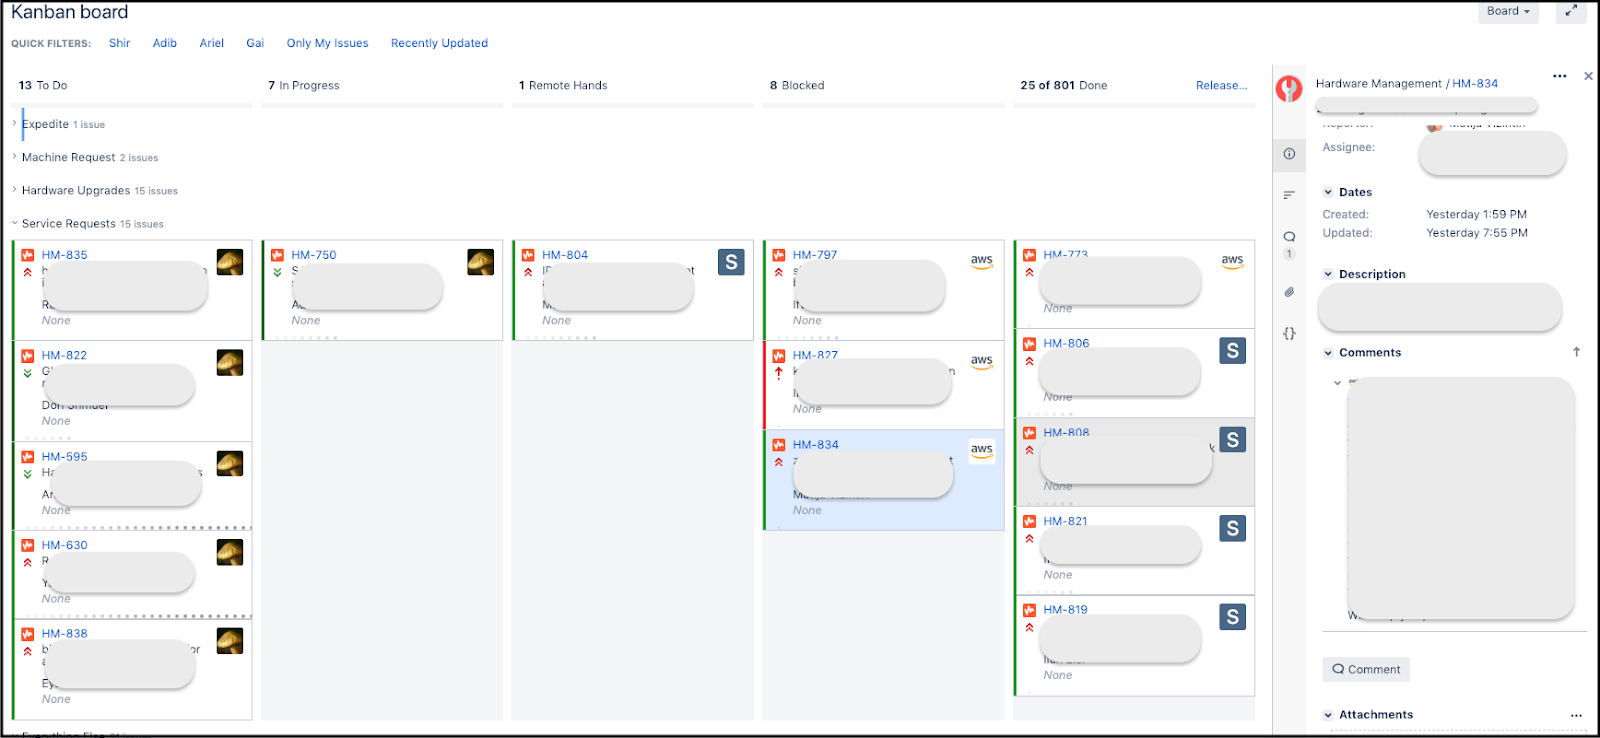
(JIRA Kanban board)
As a bonus, the fact that queues and priorities were now visible to all, gave visibility into “where in line” each request stood, what came before it, what stage it was in, and allowed owners to shift priorities within their own requests without having to talk to us. As simple as a “drag and drop”. It has also allowed us to estimate and continuously evaluate our SLAs according to the types of request, based on metrics generated by JIRA.
The Inventory Lifecycle Domain
You could only imagine the complexity of managing the parts that go in each server. To make things worse, many parts (memory, disk) can find themselves traveling back and forth from inventory to different servers and back, according to the requirements. Lastly, when they fail, they are either decommissioned and swapped, or returned to the vendor for RMA. All of this, of course, needs to be communicated to the colocation staff onsite who do the actual physical labor. To tackle these challenges we have created an internal tool called Floppy. Its job is to:
- Abstract away the complexities of adding/removing parts whenever a change is introduced to a server
- Manage communication with the onsite staff including all required information – via email / iPad (more on that later)
- Update the inventory once work has been completed and verified
The inventory, in turn, is visualized through a set of Grafana dashboards, which is what we use for graphing all our other metrics. So we essentially use the same tool for inventory visualization as we do for all other production needs.
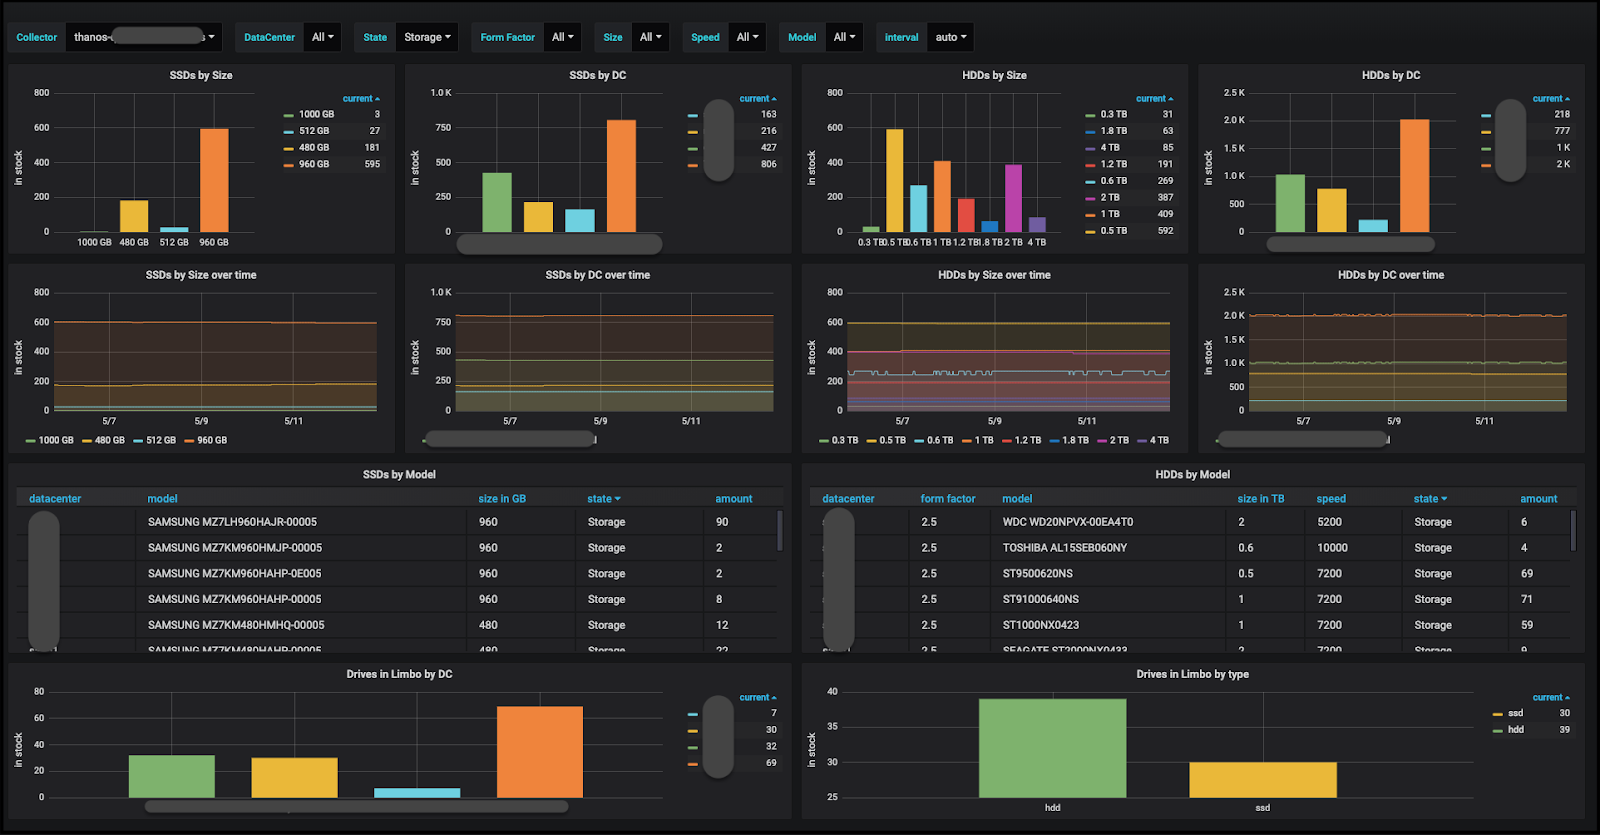
(Disk inventory management Grafana dashboard)
When a server is still under warranty, we invoke a different tool we’ve built, called Dispatcher. It’s jobs are to:
- Collects the system logs
- Generate a report in the preferred vendor’s format
- Open a claim with the vendor via API
- Return a claim ID for tracking purposes
Once the claim is approved (typically within a business day), a replacement part is shipped to the relevant datacenter, and is handled by the onsite staff.
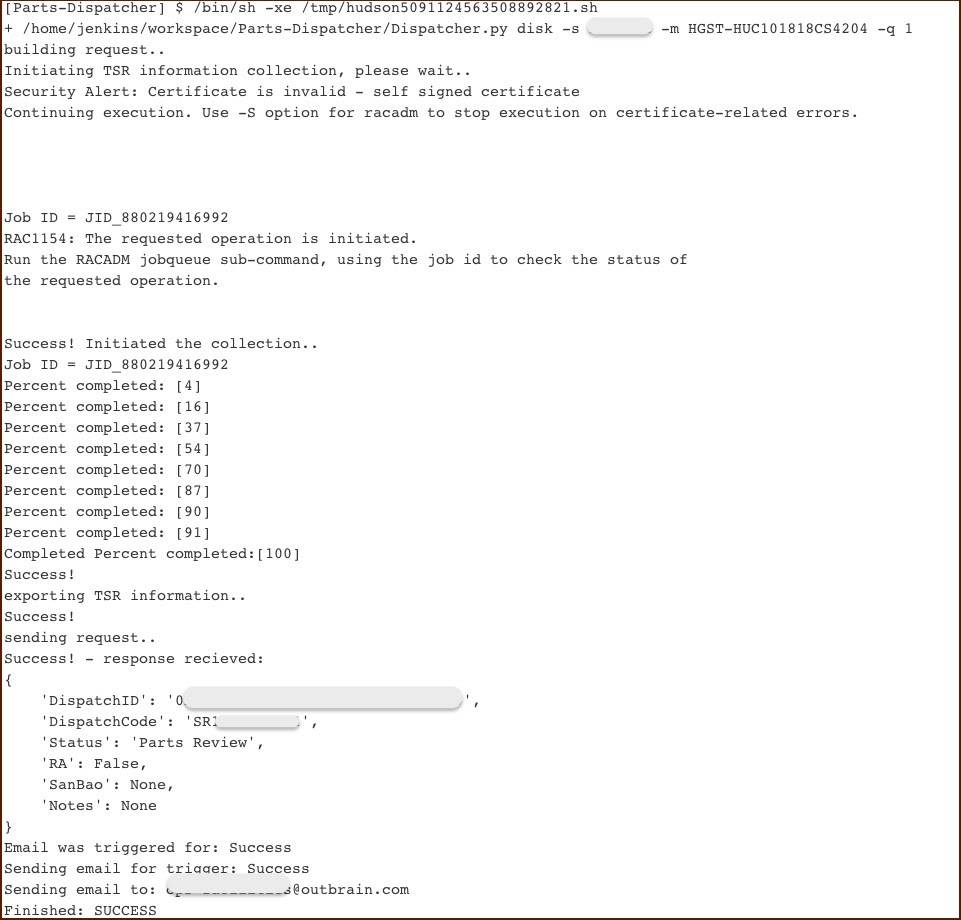
(Jenkins console output)
The Communication Domain
In order to support the rapid increases in capacity, we’ve had to adapt the way we work with the onsite data center technicians. When at first growing in scale meant buying new servers, following a large consolidation project (powered by a move to Kubernetes), it became something entirely different. Our growth transformed from “placing racks” to “repurposing servers”. So instead of adding capacity, we started opening up servers and replacing their parts. To successfully make this paradigm shift, we had to stop thinking about Outbrain’s colocation providers as vendors, and begin seeing them as our clients. Adopting this approach meant that we would need to design and build the right toolbox to help make the work of data center technicians:
- Simple
- Autonomous
- Efficient
- Reliable
All the while abstracting away the operational differences between our different colocation providers, and the seniority of the technicians at each location. We had to remove ourselves from the picture, and let them communicate with the server without our intervention and without making assumptions involving the workload, work hours, equipment at hand, and other factors.
To tackle this we had set up iPad rigs in each data center. Once plugged into a server, the following would happen:
- The mechanism validates that this is indeed a server that needs to be worked on
- The application running on the server is shutdown (where needed)
- A set of work instructions is posted to a Slack channel explaining the required steps
- Once work is completed, the tool validates the final state is correct
- And if needed, restarts the application
In addition, we have also introduced a Slack bot meant to service the technician, with an ever expanding set of capabilities to make their work smoother and our lives easier. By doing so, we’ve turned most of the process of repurposing and servicing servers into an asynchronous one, removing ourselves from the loop.
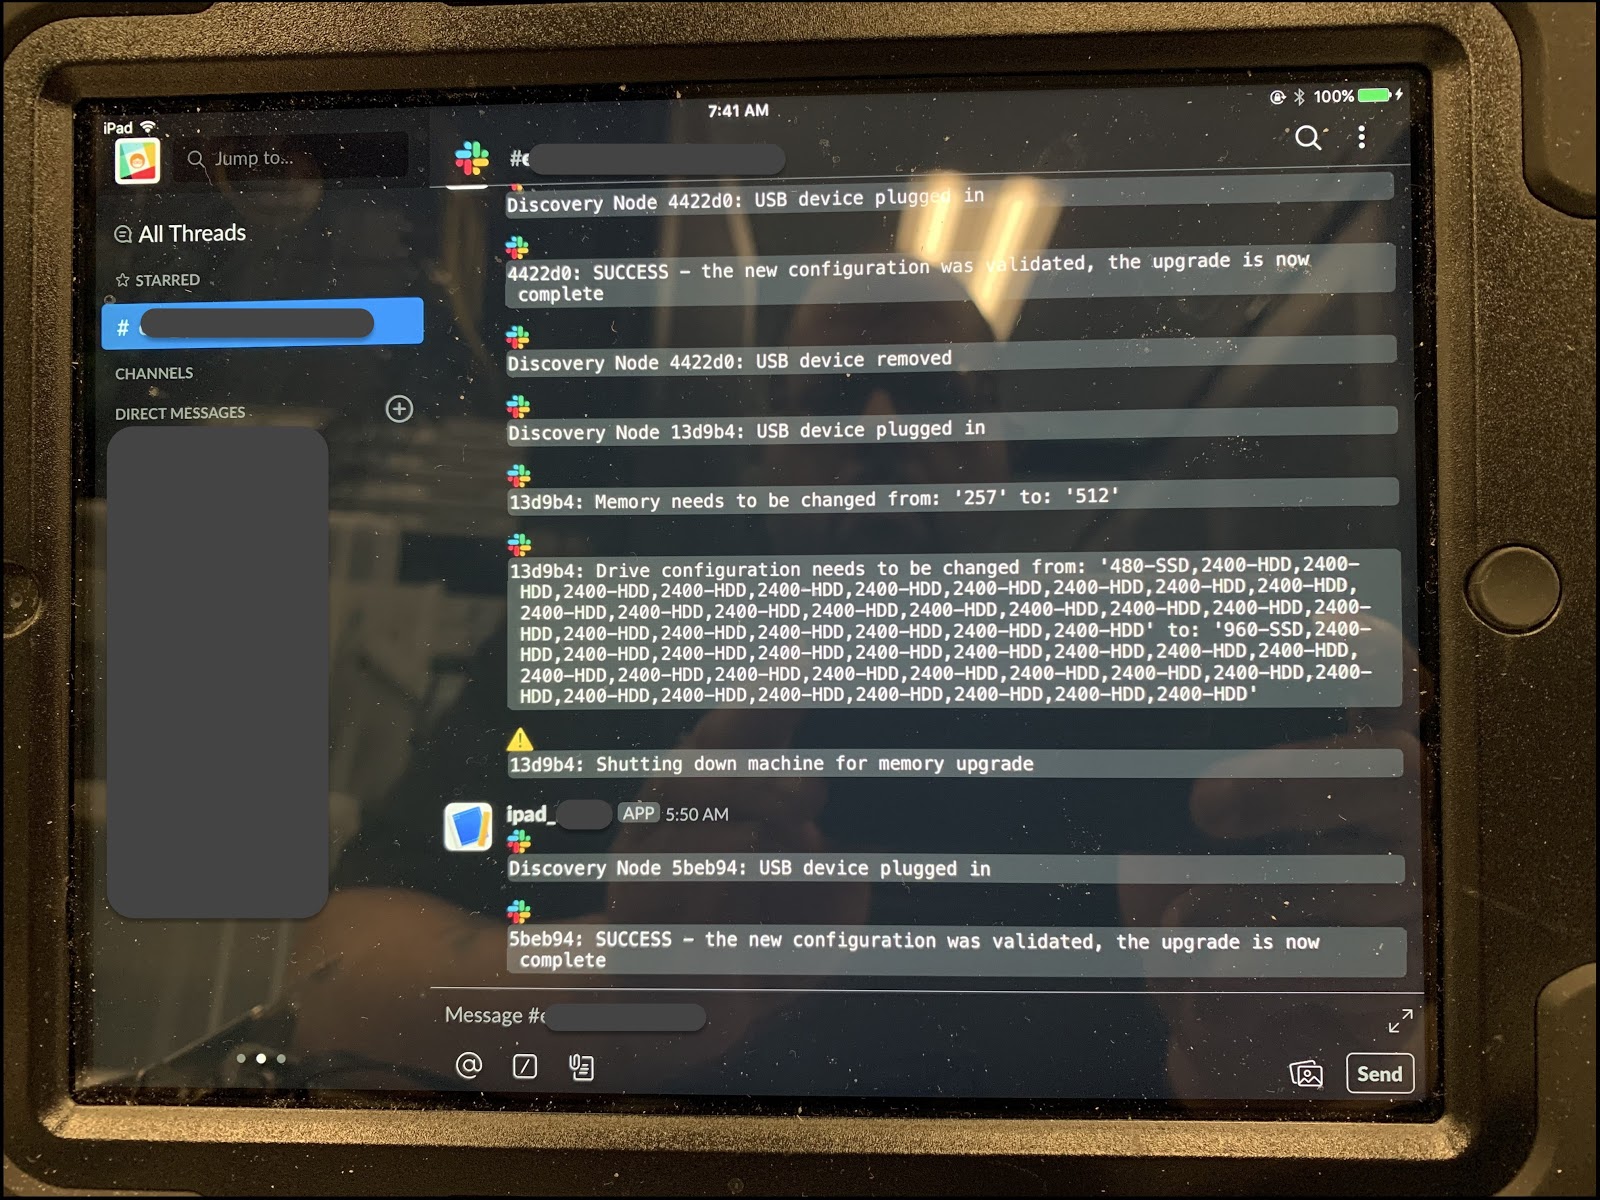
(iPad rig at one of our data centers)
The Hardware Observability Domain
Scaling our datacenter infrastructure reliably requires good visibility into every component of the chain, for instance:
- Hardware fault detection
- Server states (active, allocatable, zombie, etc)
- Power consumption
- Firmware levels
- Analytics on top of it all
Metric based decisions allow us to decide on how, where and when to procure hardware, at times before we even get the demand. It also allows us to better distribute resources such as power, by identifying workloads which are more demanding. Thus, we can make informed decisions as to server placement before a server is racked and plugged into the power, throughout its maintenance cycles, and up to its eventual decommissioning.

(Rack power utilization dashboard in Grafana)
And then came COVID-19…
At Outbrain, we build technologies that empower media companies and publishers across the open web by helping visitors discover relevant content, products and services that may be of interest to them. Therefore, our infrastructure is designed to contain the traffic generated when major news events unfold.
The media coverage of the events surrounding COVID-19 coupled with the increase in visitors traffic has meant that we had to rapidly increase our capacity to cope with these volumes. To top it off, we had to do this facing a global crisis, where supply chains were disrupted, and a major part of the workforce was confined to their homes.
But, as we described, our model already assumes that:
- The hardware in our data centers, for the most part, is not physically accessible to us
- We rely on remote hands for almost all of the physical work
- Remote hands work is done asynchronous, autonomously and in large volume
- We meet hardware demand by method of “building from parts” vs “buying ready kits”
- We keep inventory to be able to build, not just fix
So the global limitations preventing many companies from accessing their physical data centers had little effect on us. And as far as parts and servers go – yes, we scrambled to secure hardware just like everyone else, but it was to ensure that we don’t run out of hardware as we backfill our reserves rather than to meet the already established demand.
In summary, I hope that this glimpse into our world of datacenter operations shows one can apply the same principles of good code design to the physical domains of datacenter management, and live to tell.
Want to hear more about the way we run our data centers? Stay tuned for the next part!