
Distributed Tracing
Distributed Tracing is a mechanism to collect individual requests across micro-services boundaries. It also enables instrumentation of application latency (how long each request took), tracking the life-cycle of network calls (HTTP, RPC, etc) and also identify performance issues by getting visibility on bottlenecks. Plenty of articles are on the inter-webs describing various implementations of Distributed Tracing. This blog will focus on our experience rolling out tracing into our ecosystem with tales of what not to do.
What we need to solve
Outbrain has hundreds of micro-services running on top of Kubernetes. We have metrics via Prometheus and Netflix Hystrix dashboard to monitor overall health, but we lack visibility on business requests. For example, when a user clicks an ad, we want to see the exact flow. In particular, we may want to see the bid request/response to our partners for performance or fraud reasons. But we don’t have something that allows us to examine an individual request. This is what tracing solves for us; the ability to capture exact business logic for a specific request. Tracing can answer such questions:
Did I hit cache or go to a datastore? What services were used for this specific business logic request?
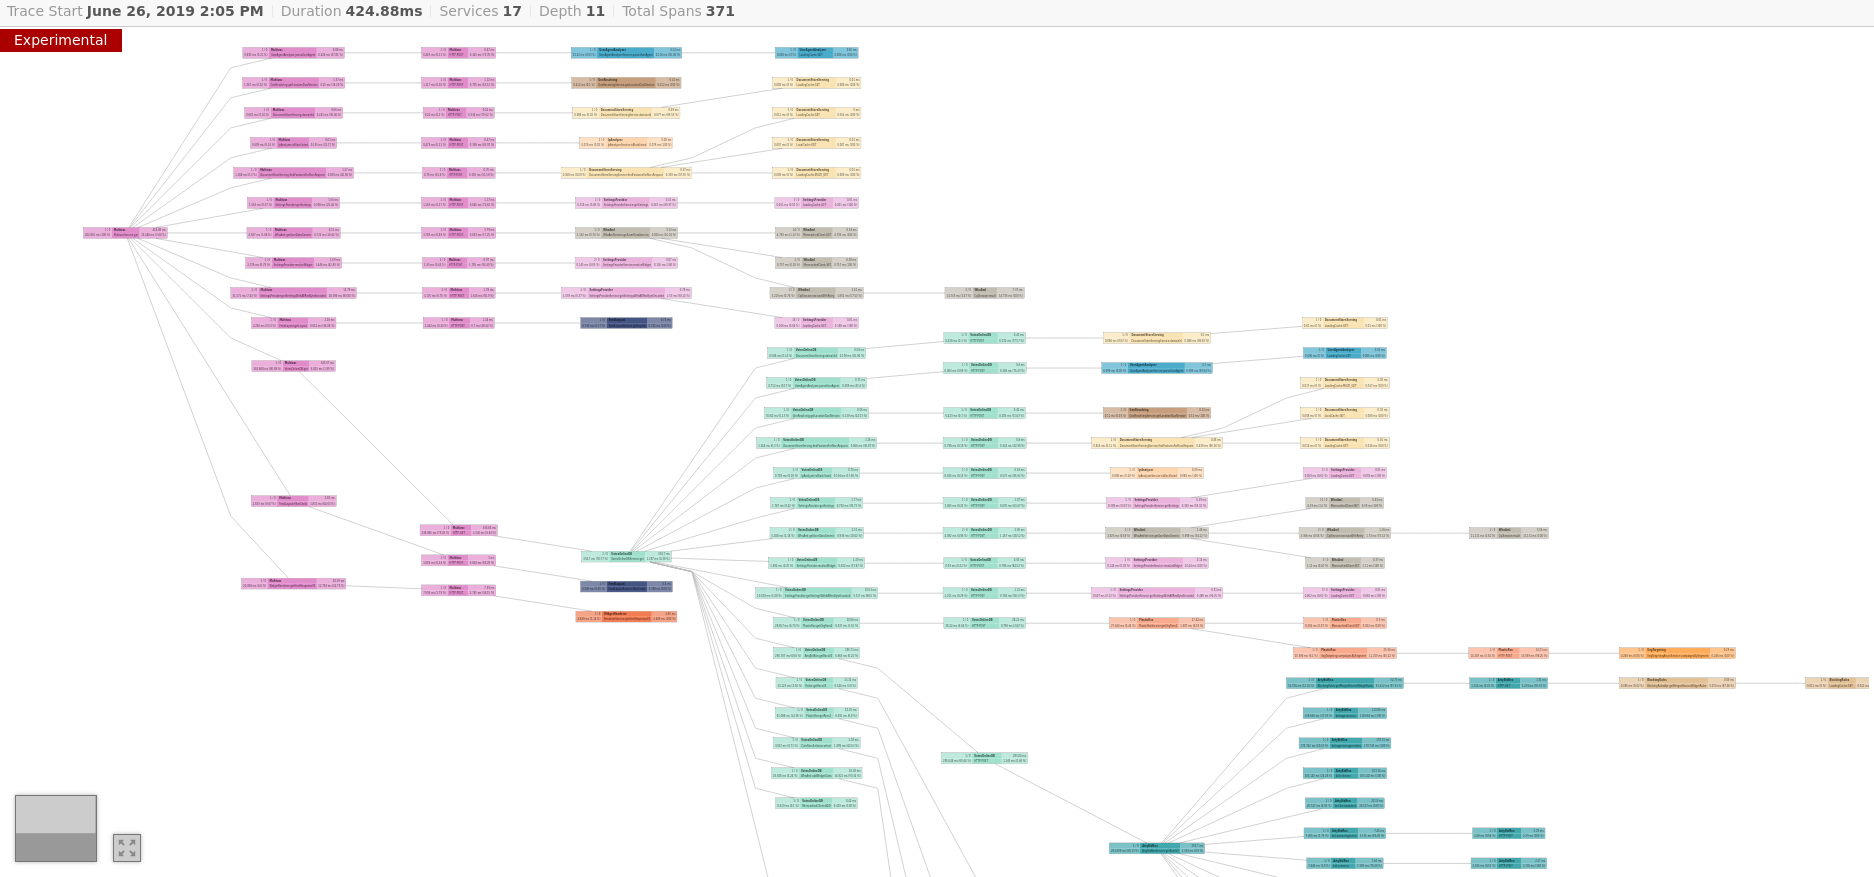
We implemented tracing with Jaeger to visualize and store our traces:
The First Rule
The first rule of tracing is no one should know about tracing. Tracing should be behind a magical curtain of abstraction; all without developers knowledge. Depending on your organization development practices and usage of core infrastructure (e.g. HTTP clients, RPC framework, database drivers…etc), this maybe difficult. But if the majority of your organization uses one or two HTTP clients (i.e. OkHttp, Apache HTTP) it is rather trivial instrument those clients with tracing capabilities without much developer intervention. By instrumenting only HTTP clients and servers you will get a huge benefit with tracing. Think of the 80/20 rule when you plan your tracing implementation.
What not to do
Conceptual, tracing is easy to understand. Operationally, it can turn into a mess. There is an overhead to tracing, albeit small, but still you don’t want to get OutOfMemory errors because of tracing. So don’t by start tracing everything!
Besides, if you start tracing everything what are you going to do with all that data? Depending on your request load this could be huge. Sure, you solved tracing your micro-services, but you created massive amount of data (and hardware) that probably no one is going to look at. In the beginning, keep your operational costs to a bare minimum. You could start by dumping traces into your existing logging infrastructure (i.e. put the trace Id as MDC context in all logging statements). No extra hardware (collectors) required! Like designing software, start small and increment your changes overtime.
Slow and steady wins the race
Begin your tracing quest by providing a mechanism which will “turn on” tracing manually. Suppose you have a REST API, by detecting a special request header, say “X-AdHocTrace”, will inform the service that tracing has been requested. This will enable tracing to all downstream servers as well. We use swagger at Outbrain and added the header automatically:
window.onload = function() {
 const ui = SwaggerUIBundle({
 url: "../api/swagger/apiDocs",
 requestInterceptor: function(request) {
   request.headers['X-AdHocTrace'] = "true";
   return request;
}
When developers are testing their services (locally or remotely) they automatically get all their calls traced when using swagger.
Overtime you can add more sophisticated sampling mechanisms. For instance you could sample all request that result in a 500 HTTP status code.
It’s a trap
Despite being around for a while, the tracing world has no official standards. Sure there is ZipKin, OpenTracing and OpenCensus but
they are frameworks and opinionated implementations of tracing. There is a W3C working group in progress and then there’s proprietary vendor solutions. Don’t use out-of-the box tracing frameworks and expose them as a direct dependency in your code. Instead, create a wrapped tracer which mimics a known tracer and tailored it to your own organization. Treat the tracer as a combination of metrics and logger. Hide creating traces internally to components, e.g. JDBC driver, but allow developers to enhance or enrich the trace with business specific logic:
public class UserDao {
  static Tracer tracer = TracerProvider.getTracer();
  public boolean delete(long userId) {
    tracer.log("deleting user " + userId);
    tracer.tag("userId", userId) // Or use a tag
    ...
  }
}
Trace be Nimble. Trace be Silent.
We took a quick and silent approach within Outbrain’s tracing infrastructure. We use metrics to record tracing activity such as span creation rates and internal trace errors. We decided to not log trace errors as this may bombard an application with logs that owners won’t know how to solve. Test what would happen if your trace collector is non-responsive or slow to accept requests. Application should behave normally even when trace infrastructure falls apart.
Another trick we used was wrapping tags and (trace) logs with lambdas (Supplier in JAVA lexicon). If you have an expensive tag, say a request body, use a lambda:
tracer.withTag(“body”, () -> objectMapper.writeValueAsString(pojo))
Due to Outbrain’s ad hoc tracing approach, expensive tags are only executed a small fraction of the time thus saving on performance.
Integration Tests
Do you have integration test or a simulated environment? Why not enable tracing in the tests? It is a good way to see how tracing behaves in near production like scenarios without overloading your services. The other benefit is when a test fails you have a trace which can help you troubleshoot.
In conclusion
Treat tracing as additional monitor tool in the ecosystem, not a replacement. Start slow, increment your changes, be silent and performance neutral. We abstracted creating spans within our own framework so developers don’t create spans themselves. Finally, treat the tracer as a combination of a logging and metrics.
For me, the most valuable insight to tracing was detailed understanding of Outbrain’s business flows. A new employee joining a team can examine a trace to see the critical code path for specific business requests. Reviewing traces has a self-documentation feature that we didn’t expect.