At Outbrain we are big believers in Observability.
What is Observability, and what is the difference between Observability and Monitoring? I will leave the explanation to Baron Schwartz @xaprb:
“Monitoring tells you whether the system works. Observability lets you ask why it’s not working.”
@ Outbrain we are currently in the midst of migrating to a Kubernetes / Docker based environment.
This presented many new challenges around understanding why things don’t work.
In this post I will be sharing with you our logging implementation which is the first tool used to understand the why.
But first thing first, a short review of our current standard logging architecture:
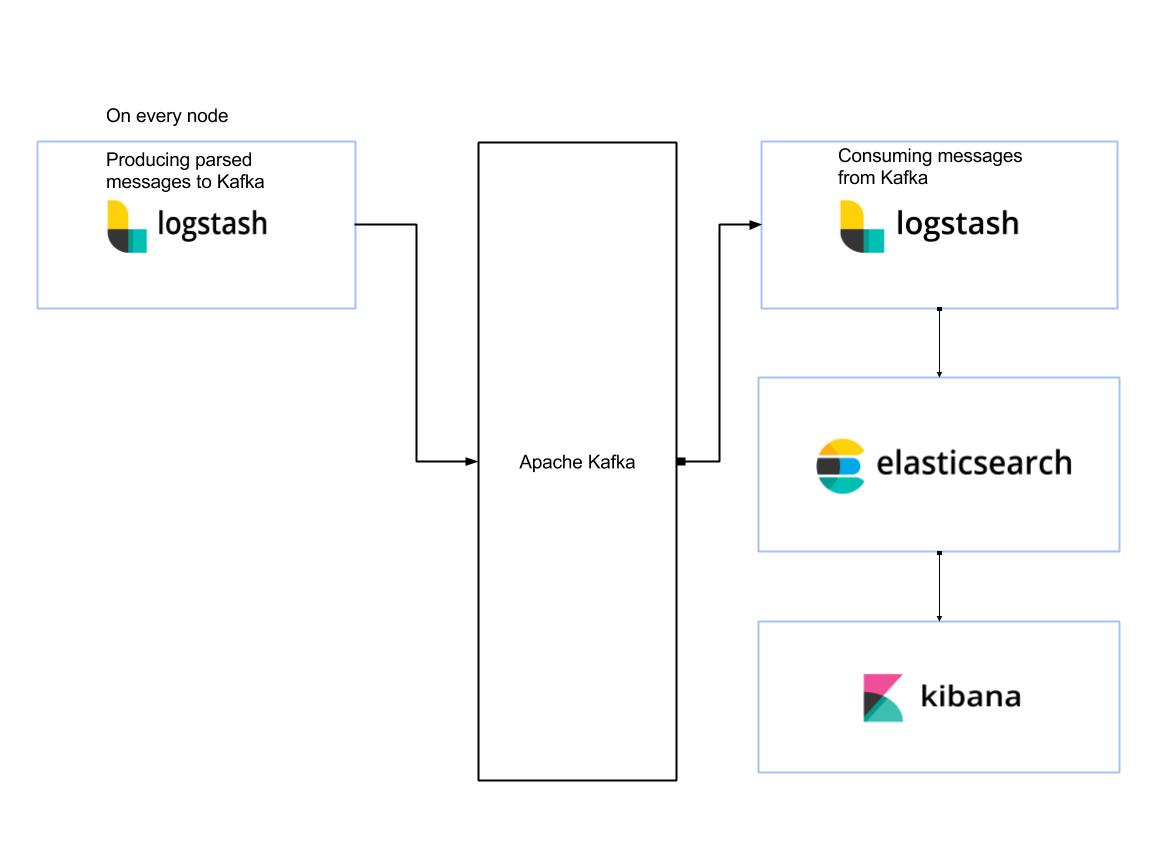
We use a standard ELK stack for the majority of our logging needs. By standard I mean Logstash on bare metal nodes, Elasticsearch for storage and Kibana for visualizing and analytics. Apache Kafka is transport layer for all of the above.
A very simplified sketch of the system:
Of course the setup is a bit more complex in real life since Outbrain’s infrastructure is spread across thousands of servers, in multiple physical data centers and cloud providers; and there are multiple Elasticsearch clusters for different use cases.
Add to the equation that these systems are used in a self-serve model, meaning the engineers are creating and updating configurations by themselves – and you end up with a complex system which must be robust and resilient, or the users will lose trust in the system.
The move to Kubernetes presented new challenges and requirements, specifically related to the logging tools:
- Support multiple Kubernetes clusters and data centers.
- We don’t want to us “kubectl”, because managing keys is a pain especially in a multi cluster environment.
- Provide a way to tail logs and even edit log file. This should be available on a single pod or across a service deployed in multiple pods.
- Leverage existing technologies: Kafka, ELK stack and Log4j on the client side
- Support all existing logging sources like multiline and Json.
- Don’t forget services which don’t run in Kubernetes, yes we still need to support those.
So how did we meet all those requirements? Time to talk about our new Logging design.
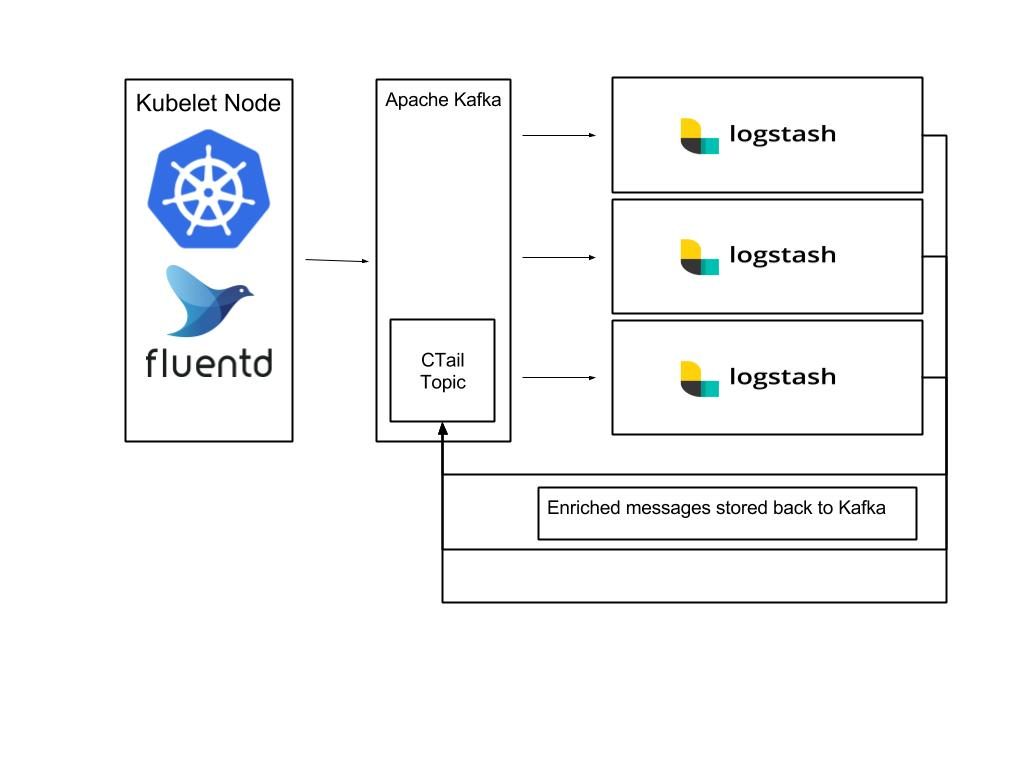
The new architecture is based on a standard Kubernetes logging setup – Fluentd daemonset running on each Kubelet node, and all services are configured to send logs to stdout / err instead of a file.
The Fluentd agent is collecting the pod’s logs and adding the Kubernetes level labels to every message.
The Fluentd plugin we’re using is the kubernetes_metadata_filter.
After the messages are enriched they are stored in a Kafka topic.
A pool of Logstash agents (Running as pods in Kubernetes) are consuming and parsing messages from Kafka as needed.
Once parsed messages can be indexed into Elasticsearch or routed to another topic.
A sketch of the setup described:

And now it is time to introduce CTail.
Ctail, stands for Containers Tail, it is an Outbrain homegrown tool written in Go, and based on a server and client side components.
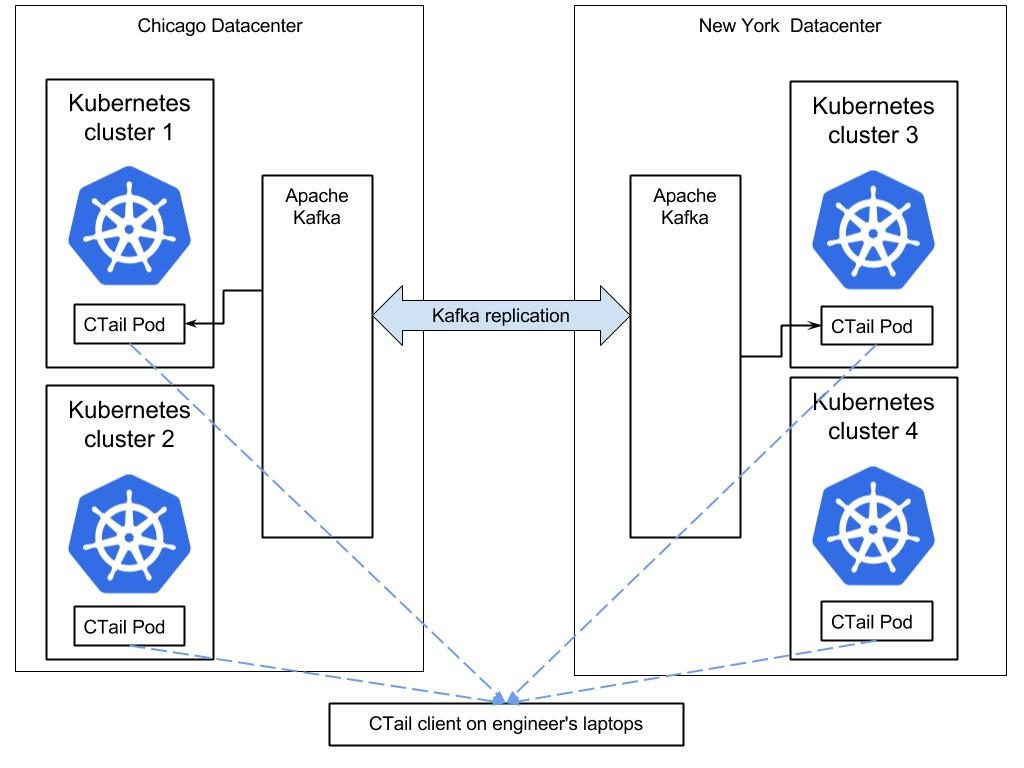
A CTail server-side component runs per datacenter or per Kubernetes cluster, consuming messages from a Kafka topic named “CTail” and based on the Kubernetes app label creates a stream which can be consumed via the CTail client component.
Since order is important for log messages, and since Kafka only guarantees order for messages in the same partition, we had to make sure messages are partitioned by the pod_id.
With this new setup and tooling, when Outbrain engineers want to live tail their logs, all they need to do is launch the CTail client.
Once the Ctail client starts, it will query Consul, which is what we use for service discovery, to locate all of the CTail servers; register to their streams and will perform aggregations in memory – resulting in a live stream of log entries.
Here is a sketch demonstrating the environment and an example of the CTail client output:

To view logs from all pods of a service called “ob1ktemplate” all you need is to run is:
# ctail-client -service ob1ktemplate -msg-only
2017-06-13T19:16:25.525Z ob1ktemplate-test-ssages-2751568960-n1kwd: Running 5 self tests now...
2017-06-13T19:16:25.527Z ob1ktemplate-test-ssages-2751568960-n1kwd: Getting uri http://localhost:8181/Ob1kTemplate/
2017-06-13T19:16:25.529Z ob1ktemplate-test-ssages-2751532409-n1kxv: uri http://localhost:8181/Ob1kTemplate/ returned status code 200
2017-06-13T19:16:25.529Z ob1ktemplate-test-ssages-2751532409-n1kxv: Getting uri http://localhost:8181/Ob1kTemplate/api/echo?name='Ob1kTemplate'
2017-06-13T19:16:25.531Z ob1ktemplate-test-ssages-2751568954-n1rte: uri http://localhost:8181/Ob1kTemplate/api/echo?name='Ob1kTemplate' returned status code 200
Or logs of a specific pod:
# ctail-client -service ob1ktemplate -msg-only -pod ob1ktemplate-test-ssages-2751568960-n1kwd
2017-06-13T19:16:25.525Z ob1ktemplate-test-ssages-2751568960-n1kwd: Running 5 self tests now...
2017-06-13T19:16:25.527Z ob1ktemplate-test-ssages-2751568960-n1kwd: Getting uri
http://localhost:8181/Ob1kTemplate/
2017-06-13T19:16:25.529Z ob1ktemplate-test-ssages-2751568960-n1kwd: uri http://localhost:8181/Ob1kTemplate/ returned status code 200
This is how we solve this challenge.
Interested in reading more about other challenges we encountered during the migration? Either wait for our next blog, or reach out to visibility at outbrain.com.