How we use Kibana (4) for user-acquisition funnel analysis
Outbrain has recently launched a direct-to-consumer (D2C) initiative. Our first product is a chatbot. As with every D2C product, acquiring users is important. Therefore, optimizing the acquisition channel is also important. The basis of our optimization is analysis.
Our Solution (General Architecture)
Our acquisition funnel spans on 2 platforms (2 web pages and a chatbot). Passing many parameter between platforms can be a challenge, so we chose a more stateful, server-based model. Client requests for a new session Id, together with basic data like IP and User agent. Server stores a session (we use Cassandra in this case) with processed fields like Platform, OS, Country, Referral, User Id. At a later stage the client reports a funnel event for a session Id. The server writes all known fields for the session into 2 storages:
- ElasticSearch for quick & recent analytics (Using the standard ELK stack)
- Hadoop for long term storage and offline reports
A few example fields stored per event
- User Id – An unique & anonymous identifier for a user
- Session Id – The session Id is the only parameter passed between funnel steps
- Event Type – The specific step in the funnel – serve, view, click
- User Agent – Broken down to Platform and OS
- Location – based on IP
- Referral fields – Information on the context in which the funnel is excercised
- A/B Tests variants – The A/B Test variant Ids that are included in the session
Goal of the Analysis: Display most important metrics quickly
Kibana plugin #1: Displaying percent metric
Kibana has several ways of displaying a fraction, but none excel in displaying small numbers. (Pie can be used to visualize fractions, but small). We developed a Kibana plugin for displaying a single metric, in percent format.

We use this visualization for displaying the conversion rate of the most interesting part of our funnel.
Kibana plugin #2: Displaying the funnel
We couldn’t find a good way for displaying a funnel so we developed a visualization plugin (honestly, we were eager to develop this, so we did not scan the entire internet..)
Based on the great D3 Funnel by Jake Zatecky, this is a Kibana plugin that displays buckets of events in funnel format. It’s customizable and open-source. Feel free to use it…

Putting it all together
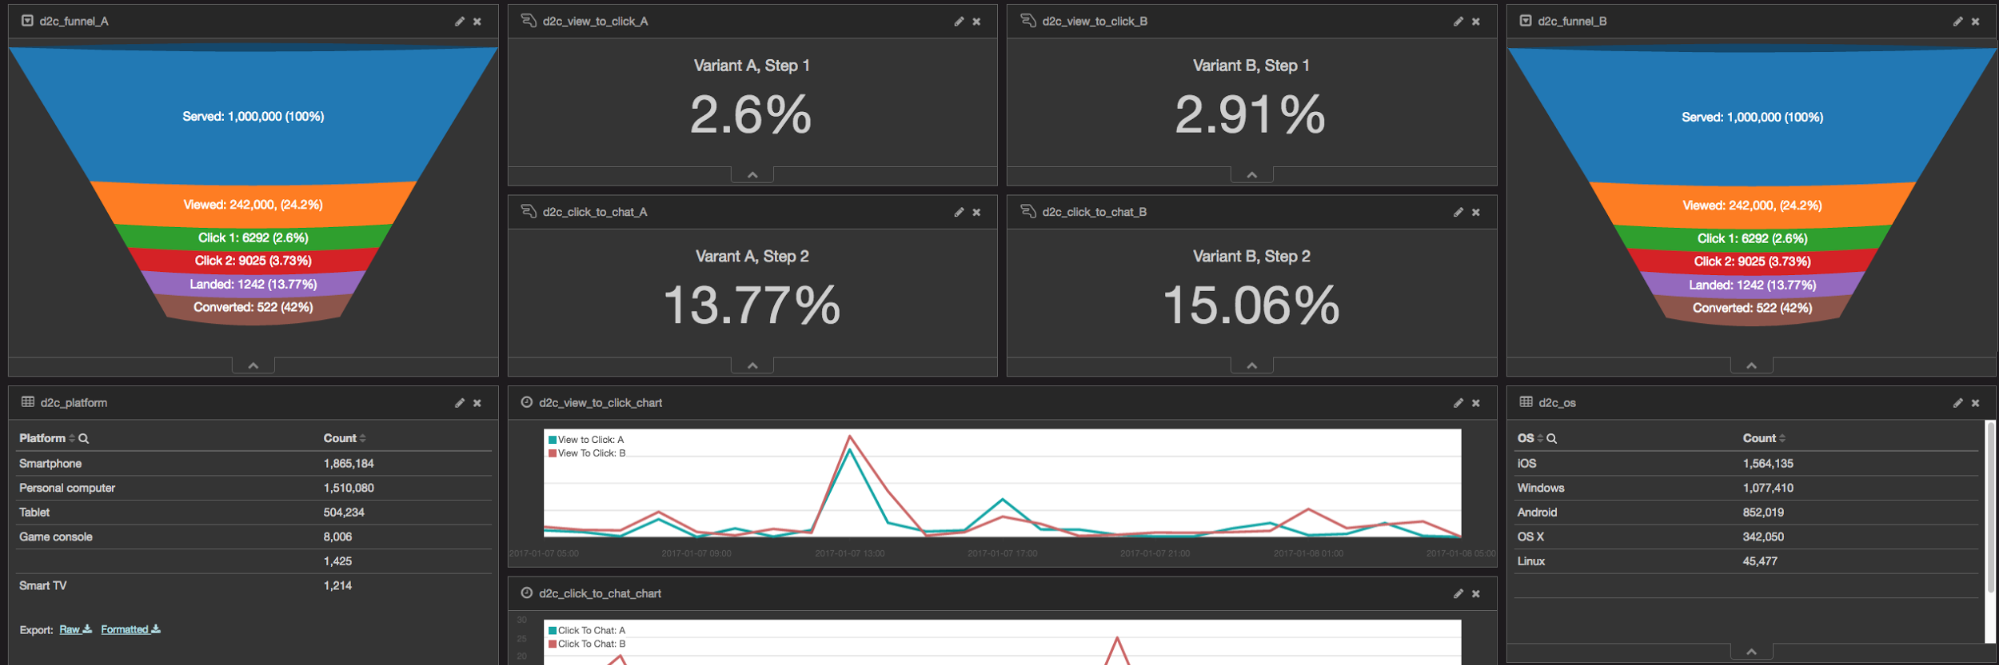
Displaying your most important metrics and the full funnel is nice. Comparing variant A with variant B is very nice. We’ve setup our dashboard to show similar key metrics on 2 versions of the funnel. We always try to run at least 1 A/B test and this dashboard shows us realtime results of our tests.

Cherry on top
A timeline is awesome. If you’re not using it, I suggest trying it.
Viewing your most important metrics over time is very useful, especially when you’re making changes fast. Here’s an example:

Summary
We track a user’s activity by sending events to the server. The server writes these events to ES and Hadoop. We developed 2 Kibana plugins to visualize the most important metrics of our user-acquisition funnel. We can filter the funnel by Platform, Country, OS, Time, Referral, or any other fields we bothered to save. In addition, we always filter by A/B Test variants and compare 2 specific variants.
Just a regular geek. Star Wars, Gaming, Java, etc.
awesome ! can’t stop saying this to you