It has been a long time (more than 4 months) since we last updated.
You can read the previous update here.
It is not that we abandoned the POC, we actually continued to invest time and effort on it since there is a good progress. It is just that we did not yet ended it and got the proofs that we wanted. While there was a lot of progress in both Outbrain system side and ScyllaDB side on those 4 months, there is one things that is holding us back from showing trying to prove the main point of this POC. Our current bottleneck is the network. The network on the datacenter where we are running the tests on is 1Gbps ethernet network. We found out that although Scylla is not loaded and works with good latencies we are saturating the NICs. We did some improvements along the way to still show that Scylla is behaving better than C* but if we want to show that we can significantly reduce the number of nodes in the cluster, we need to upgrade to 10Gbps ethernet.
This upgrade will come shortly.
This is where we currently stand. However – a lot was done in those 4 months and there is a lot of learnings I want to share. The rest of the post is the way Doron and the Scylla guys describes what happened. It looks more like captain’s log but it tells the story pretty well.
Scylla:
- 23/6 – We created special app server cluster to call Scylla, and delegated all calls both to C* and Scylla cluster. We wanted to do that so there will be less coupling between the C* path and the Scylla path and less mutual interruptions that will interfere our conclusions. The app servers for Scylla were configured not to use cache, so entire load (1.5M-3M RPM) went directly to Scylla. C* stayed behind cache and actually handled ~10% of the load. This went smoothly.
- In the following ~3 weeks we tried to load the snapshot again from C* and stumbled with some difficulties, some related to bugs in Scylla, some to networking limits (1Gpbs). During this time we had to stop the writes to Scylla for few days, so the data was not sync again. Some actions we have done to resolve
- We investigated bursts of usage we had and decreased them in some use-cases (both for C* and Scylla). They caused the network usage to be very high for few seconds, sometimes for a few tens of milliseconds. This also helped C* a lot. The tool is now open source.
- We added client-server compression (LZ4). It was supported by Scylla, but client needed to configure it.
- Scylla added server-server compression during this period.
- Changed the “multi” calls back to N parallel single calls (instead of one IN request) – it better utilize the network.
- Scylla client was (mistakably) using latency aware over the token aware. This caused app to go to the “wrong” node a lot – causing more traffic within Scylla nodes. Removing the latency-aware helped reducing the server-server network usage and the overall latency.
- 14/7 – with all the above fixes (and more from Scylla) we were able to load the data and stabilize the cluster with the entire load.
- Until 29/7 I see many spikes in the latency. We are not sure what we did to fix it… but on 29/7 the spikes stopped and the latency is stable until today.
- During this period we have seen 1-5 errors from Scylla per minute. Those errors were explained by trying to reach partitions coming from very old C* version. It was verified by logging the partitions we fail for in the app server side. Scylla fixed that on 29/7.
- 7/8-15/8 – we have changed the consistency level of both Scylla and C* to local one (to test C*) – this caused a slight decrease in the (already) low latencies.
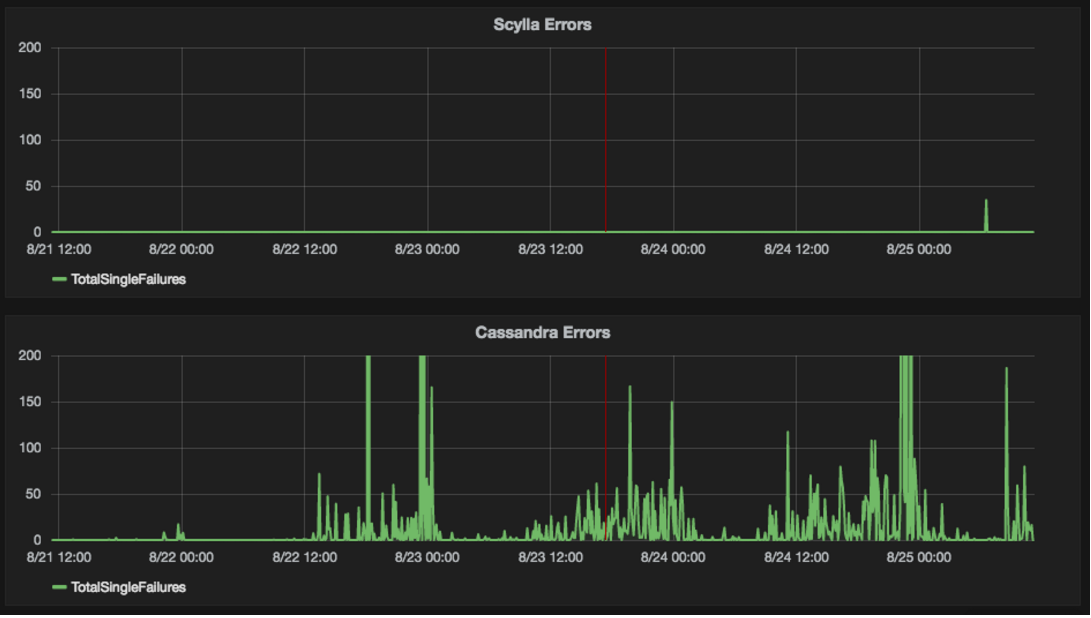
- Up to 19/8 we have seen occasional momentarily errors coming from Scylla (few hundreds every few hours). This has not happened since 19/8.. I don’t think we can explain why.
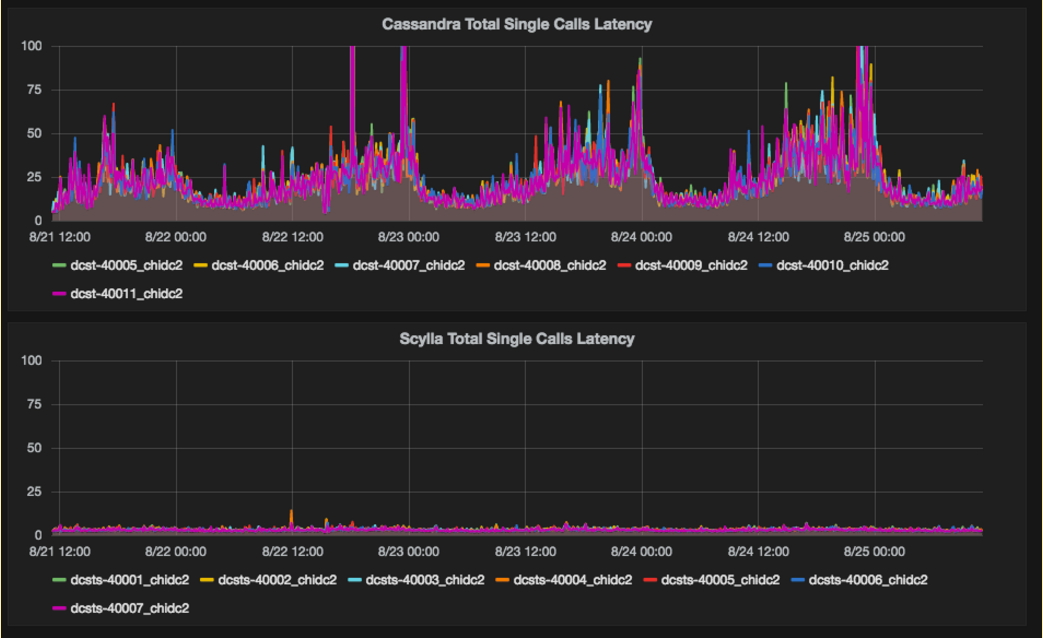
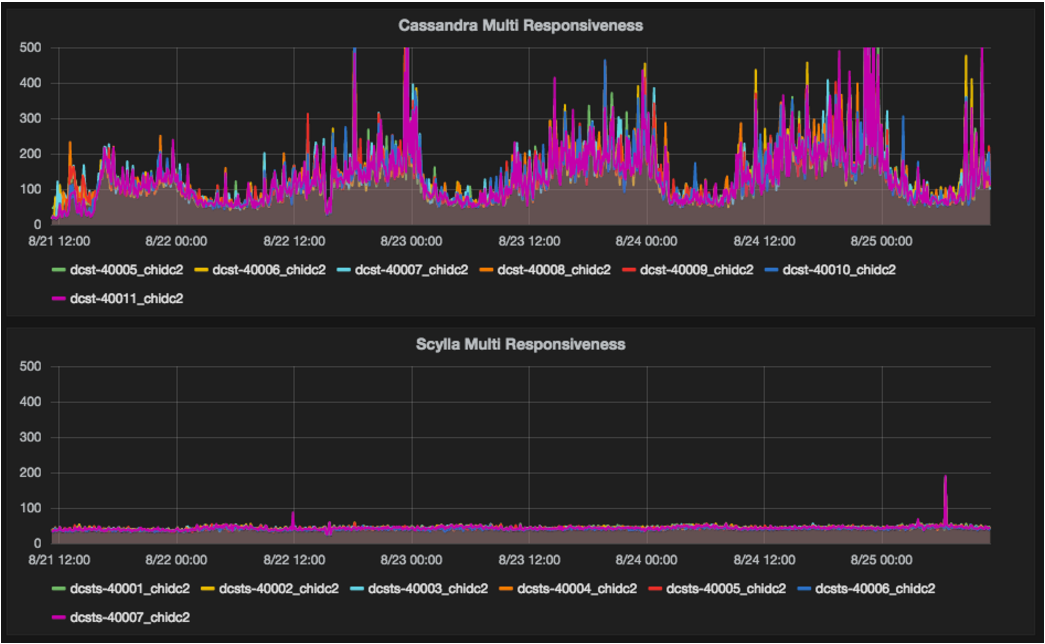
- Current latencies – Scylla holds over 2M RPM with latency of 2 ms (99%ile) for single requests and 40-50 ms (99%ile) for multi requests of ~100 partitions in avg per request. Latencies are very stable with no apparent spikes. All latencies are measured from the app servers.
Next steps on Scylla:
- Load the data again from C* to sync.
- Repeat the data consistency check to verify the results from C* and Scylla are still the same.
- Run repairs to see cluster can hold while running heavy tasks in the background..
- Try to understand the errors I mentioned above if they repeat.
- Create the cluster in Outbrain’s new Sacramento datacenter that have 10Gbps network. with minimum nodes (3?) and try the same load there.
Cassandra:
- 7/8 – we changed consistency level to local-one and tried to remove cache from Cassandra. The test was successful and Cassandra handled the full load with latency increasing from 5 ms (99%ile for single requests) to 10-15ms in the peak hours.
- 15/8 – we changed back to local-quorum (we do not like to have local-one for this cluster… we can explain in more details why) and set the cache back.
- 21/8 – we removed the cache again, this time with local-quorum. Cassandra handled it, but single requests latency increased to 30-40 ms for the 99%ile in the peak hours. In addition, we have started timeouts from Cassandra (timeout is 1 second) – up to 500 per minute, in the peak hours.
Next steps on C*:
- Run repairs to see cluster can hold while running heavy tasks in the BG.
- Try compression (like we do with Scylla).
- Try some additional tweaks by the C* expert.
- In case errors continue, will have to set cache back.
Current status comparison – Aug 20th:
The following table shows comparison under load of 2m RPM in peak hours.
Latencies are in 99%ile.
| Cassandra | ScyllaDB | |
| Single call latency | 30-40 ms (spikes to 70) | 2 ms |
| Multi call latency | 150-200 ms (spikes to 600) | 40-50 ms |
| Errors (note: these are query times exceeding 1 second, not necessarily database failures) | Up to 150 a minute every few minutes timeouts per minute, with some higher spikes every few days | few hundreds every few days |
Below are the graphs showing the differences.
Latency and errors graphs showing both C* and Scylla getting requests without cache (1M-2M RPM):
Latency comparison of single requests

Latency comparison of multi requests

Errors (timeouts for queries > 1 second)

Summary
There are very good signs that Scylla DB does make a difference in throughput but due to the network bottleneck, we could not verify it. We will update as soon as we have results on a faster network. Scylla guys are working on solution for slower networks too.
Hope to update soon.

Would love another update! thanks for writing these. 🙂
Update please! I just stumbled across ScyllaDB tonight and it sounds cool (trendy?). I’m curious what state its currently in.
Very interesting series, did you make progress on getting this tested on 10gigE? Would be great to hear more!
Updates please 🙂