by Marco Supino and Ori Lahav
Yeah — I know, monitoring is a “must have” tool for every web application/operation functionality. If you have clients or partners that are dependant on your system, you don’t want to hurt their business (or your business) and react in time to issues. At Outbrain, we acknowledge that it is a tech system we are running on and tech systems are bound to fail. All you need is to catch the failure soon enough, understand the reason, react and fix. On DevOps terminology, it is called TTD (time to detect) and TTR (time to recover). To accomplish that, you need a good system that will tell the story and wake you up if something is wrong long before it affects the business.
This is the main reason why we invested a lot in a highly capable monitoring system. With it, we are doing Continuous Deployment and a superb monitoring system is an integral part of the Immune System that allows us to react fast to flaws in the continuous stream of system changes.
Note: Most of the stuff we have used to build it are open-source parts and projects that we gathered for our use.
A monitoring system is usually worthless if no one is looking at it. The common practice here is to have a NOC that is staffed 24/7. At Outbrain, we took another approach where instead of seating low-level engineers in front of the screen all the time and alerting high-level engineers when something happens, we built a system which is smart enough to alert the high-level engineers in the shift and tell them the story. We assume this alert can catch them wherever they are (at the playground with the kids, at the supermarket, etc…) and they can react to it if needed.
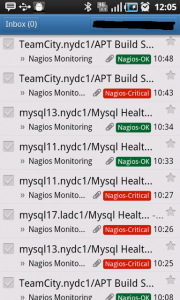
The only thing an Ops engineer in shift needs next to him is his smartphone and his notebook. Most of the time in order to understand the issue — he needs no more than a smartphone Gmail mailbox that looks like this:

Gmail Labels are used to color alerts according to the alert type — making the best use of the short space available on the Android smartphone.
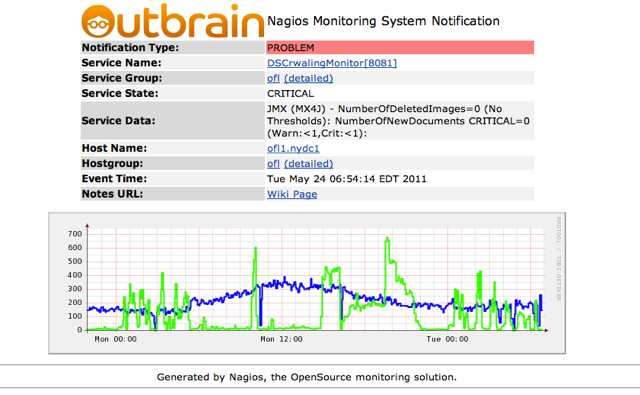
Nagios alerts are also sent via Jabber… to handle situations where Mail is down. The Nagios alert that comes with it includes the details about the alert and if it is a trend graph that is going over a threshold it also has the graph that shows the trend and tells the story.

And…. yes — we use Nagios, one of the oldest and most robust monitoring systems. Its biggest advantage is that it doesn’t know to do ANYTHING. That system just says “script for me anything you want me to monitor” and by that gives you full freedom to monitor everything you wish. We did great things with Nagios from monitoring the most basic vitals of the machines up to each and every JMX metric that our services expose and on into the bandwidth between our data centers.
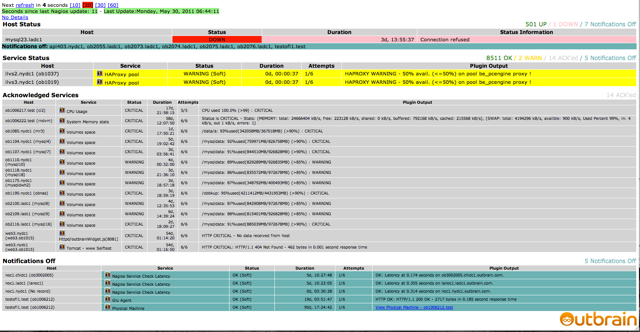
One of the things that Nagios does not do well enough is supplying an aggregated view of the system state. For that, we have put a “Nagios dashboard” application that puts the state in front of the engineer looking at it.
Our dashboard is based on NagLite3 with some local modifications to differently handle some situations and our naming scheme.

The options we support are “wassup”,”ack”,”resched”,”dis/ena” etc.
Alerts sent from Nagios have a uniq ID added to the subject, for example:
The great part of using Jabber is that it’s available on our smartphones (android based), so it’s easy to communicate with Nagios from everywhere (where Internet is available).
As I said above, working with Continuous Deployments raises a lot of challenges regarding faults and the ability to investigate them, identifying the root cause and fixing it. At Outbrain, every engineer can change the production environment at any time. Deployments are usually very small and fast and the new functionality introduced is very isolated and can be found in the SVN commit note. Regular process is for the developer to commit the code with the proper note and flags inside it. Then the TeamCity builds it and runs all tests. If tests went well there is a GLU feeder that catches the SVN message hook and starts the deployment process.
As part of the deployment it hits 2 APIs:
One for Yammer where this deployment is logged.
And the second one is to the Nagios where it is registered and from now on it will be shown as a vertical line on each of the Nagios graphs. So, in case there is a problem that will be visible in the Nagios graphs, we will be able to attribute it to the deployment in proximity.
The graphs are exposing 2 pieces of data: the revision number that can be searched in Yammer and the name of the engineer responsible for it so we can refer to him to ask questions. Note: this functionality was inspired by Etsy engineering — Track Every Release.
GLU Deployments also disable/enable notifications in Nagios for the host currently being deployed to, using NRDP — again, heavily modified to match our requirements, in order to avoid false alerts while nodes are restarted because of a version roll-out.
Another thing that sometimes help to analyze issues or at least distinguish between true and false alarm is to see what were the values at the same day last week (WOW -WeekOverWeek).
In some of our Nagios graphs (where it is relevant), there is a red line showing how this metric behaved at the same time, last week.
Scaling Nagios:
Our current Nagios implementation handles around 8.5k services and 500 hosts (physical/logical), and can grow much larger.
We run it across 3 DC’s around the US, and our Nagios runs in a distributed mode. A Nagios node in each DC handles checks of the services in its “domain” (DNS domain in our case), and sends outputs to a central Nagios. The central Nagios is responsible for sending alerts and creating graphs. In case the “remote” Nagios nodes can’t contact the central Nagios, they will enable notifications and start sending alerts on their own, until the central comes back. Some cross-DC checks are employed, but we try not to use them on regular checks, only for sanity checks.
In case a “remote” Nagios is not sending alerts on time, the Central Nagios will start polling the services for that “remote” agent that’s not working using Nagios’s “Freshness checking” option.
This image from the Nagios Site shows a bit of the architecture, but because of limits in NSCA daemon, we used NRD which has some great features and works much better then NSCA.
Some more tricks to make Nagios faster:
1. Hold all the /etc of Nagios in RamDisk (measures needs to be taken to be able to restore it if the machine crashes).
2. Hold the Nagios status file (status.dat) in RamDisk.
NOTE: tmpfs can be swapped, so we chose the Linux RamDisk and increased the RamDisk size to 128mb to hold the storage we need.
3. Use NagiosEmbbededPerl where possible, and try to make it possible… the more the better. (assuming Perl is your favorite Nagios-plugin language).
4. Use multiple Nagios instances, on different machines, and as close to the monitored service as possible.
** The average service check latency here is <0.5sec on all nodes running Nagios.
Graphs are based on NagiosGraph, again, with many custom modifications, like the “Week over Week” line, and the Deployment vertical marks.
NagiosGraph is based on RRD, and multiple Perl cgi’s to make it run/view, we update ~8.5k graphs in every 5 minutes cycle.
RRD Files can be used in other applications — for example, we use it to build a Network Weather-Map, based on PHP WeatherMap, to create a viewable image of the links between our DC’s and the network load and latency between them, graphs and WoW info.
Summary:
These are just few examples of monitoring improvements we have put to the system to take it to the level of comfort that will ensure that we catch problems before our customers and partners and can react fast to solve them.
If you have more questions suggestions or comments – please do not hesitate to write a comment below.
Acknowledgements/Applications used:
Nagios – The Industry Standard In IT Infrastructure Monitoring
NagiosGraph – Data collection and graphing for Nagios
Nagios Notifications – based on Frank4dd.com scripts, with changes.
NRD – NSCA Replcament.
NRDP – Nagios-Remote-Data-Processor
PHP WeatherMap – Network WeatherMap
NagLite3 – Nagios status monitor for a NOC or operations room.
Yammer – The Enterprise Social Network
Jabber
GLU – Deployment and monitoring automation platform – by LinkedIn
and many more great OSS projects…
“Monitoring a Wild Beast