4 Metrics to Track Before You Start A/B Testing


One of the most important parts of optimizing a website is identifying the best uplift opportunities. To do so you must analyze your data, find the pages that need optimization and define a strategy.
Once we’ve identified the key leaks in the funnel that need optimization, we can then build a strategy that focuses on the methodology.
The process of building a strategy includes identifying the emotional needs of our customers, understanding their goals, coming up with hypotheses and only then working on the actual changes and designs.
Google Analytics tells us where the problems are in the funnel, strategic research helps identify why these problems are happening and how to fix them.
Finding the Leaks in Your Funnel
Single metrics and averages show a distorted overview of the status quo.
The only way to get meaningful numbers in Google Analytics is to start by looking at the website as a whole and analyze the entire flow, KPIs, and technology. Only then can you see the numbers in the right perspective.
By looking at singular metrics you may notice that you have a general high bounce rate and conclude that your landing page or homepage needs optimizing, however by diving deeper and looking at the entire flow you could find out that you have an iFrame on the landing page that counts every action on that iFrame as a bounce for the site.
For a full guide on how to adjust your bounce rate for content, read our post on “Using Google Tag Manager to increase engagement on your content.”
This is an actual case we experienced with one of our clients, that we solved by adding events on the iFrame and getting a better picture of the funnel. The new data showed – there wasn’t a high bounce rate after all.
Complete reports show valuable insights of the flows on your website, however always remember that Google Analytics tells you where the problem is but not what it is.
So, once you’ve figured out the main areas of the site that need optimizing you will then need to prioritize, and find the best place to start optimizing in terms of:
- Time – how long it will take to get to meaningful results
- Resources – how many people and resources you will need in order to run the test
- Impact – how much real impact will the test have on your bottom line results, where it matters
These 3 elements are a part of the BuyerLegends scoring methodology by Brian and Jeffrey Eisenberg. Only once you’ve found the problematic areas on your site and prioritized them, you can then move on to researching the problem, defining a strategy and testing.
Below are some key reports I like to use in order to identify the issues in our funnel at Banana Splash.
Funnel Visualization
You can find this report by clicking on Conversions → Goals → Funnel Visualization.

This report allows you to start identifying the main leaks in your funnel and locate the biggest drops. Most times you’ll find the biggest drop at the top of the funnel, like in the example below.
The home page has an 11.56% conversion rate vs. the following downloads page which has a 60.79% conversion rate.
This gives us an indication that the main leak is at the top of the funnel and that we should dig deeper into the issues on the home page.
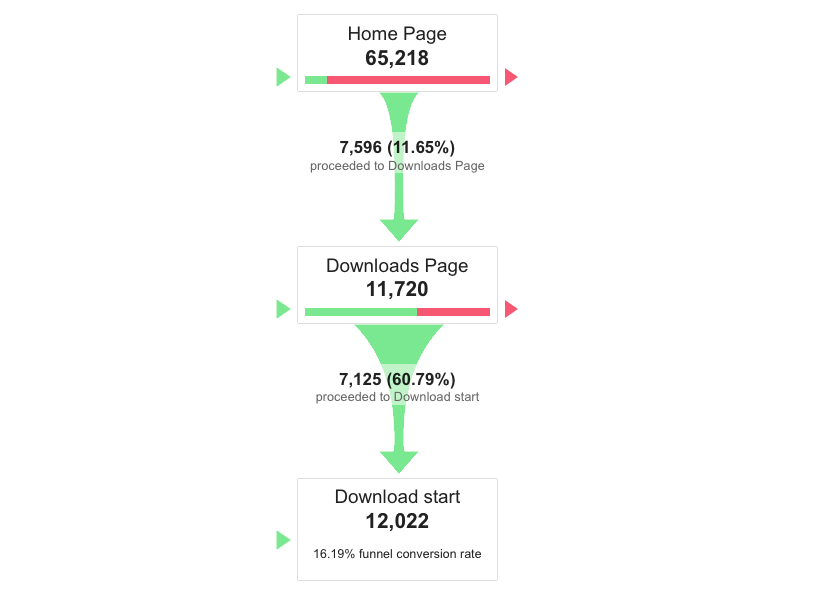
The funnel visualization will give us a hint and indication to start digging into the data.
However, don’t stop there. To ensure the report is showing correct numbers and data, make sure to go to the separate pages and verify the numbers.
Go to Behavior → Site Content → All Pages report and manually count each part of the funnel to make sure the data correlates.
It’s a methodology we focus on at Conversioner — if you see discrepancies, there’s probably a problem with the way the funnel is set up.
But remember, major drops in certain pages are not always related to that specific page.
For example, a large drop on a certain page might not necessarily be because of its performance but due to poor traffic, or inconsistent messaging between the ad and the landing page.
To find the real issue, go through the entire funnel manually and QA it on different browsers and devices, you could be overlooking many technical issues you weren’t aware of. All these should be thoroughly checked and optimized.
Top Landing Pages
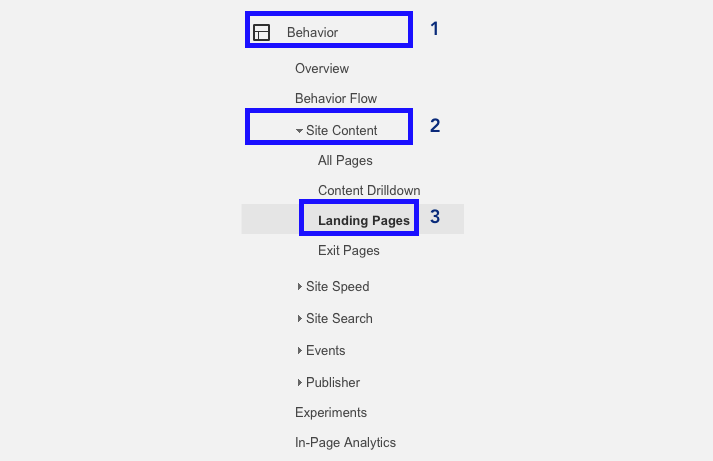
You can find this report via Behavior → Site Content → Landing Pages
The top landing pages report presents the top pages your visitors land on in your site.
This could be your homepage, product pages or dedicated landing pages you’ve created for separate campaigns. Identifying your top landing pages will help analyze the performance of these pages and detect if they need optimizing.
By enabling eCommerce tracking in GA, you can identify top converting landing pages and pages that need optimizing. You can also divide these landing pages by traffic sources, type of device and geographical location.
All views will give us a clearer understanding of our top pages’ performance.
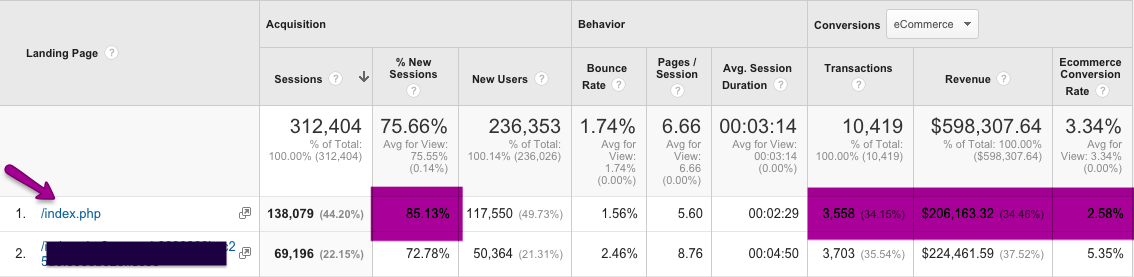
For example, the report below shows that the page with the most sessions (138k sessions) produced 3,558 transactions while the second page with half the number of sessions produced almost the same amount of transactions.
These results should make us dig deeper and ask ourselves:
- How come the page with least sessions drives the same amount of revenue and transactions?
- What can we apply from the second most viewed page to the most viewed one?
Source: Rankwatch
Looking at the top landing page and analyzing its funnel will give us a better indication to where the problem is (the ad, the landing page or maybe the next parts of the funnel).
Remember to drill down to devices and browsers to better understand if you have a technical issue or a certain drop in conversions on a specific part of the funnel.
Exit Pages
Exit pages help identify drop-offs in the funnel.
The main difference between bounce rate and exit pages is that a bounce counts the people who exited the first page they landed on. Exit rate shows the percentage of people leaving all pages in the funnel.
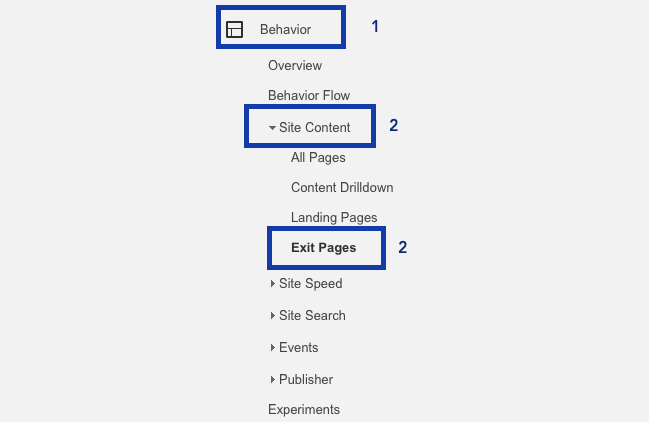
You can view this report via Behavior → Site Content → Exit Pages
The exit rate report counts the last page viewed by every visitor’s session and then shows the pages that frequently have the highest exit rate, indicating that we should do some research on these pages.
For Conversioner, the highest exit rate pages are our blog posts, since most people read them, sign-up to the newsletter and leave, leave without taking an action or go to a related article.
Many times, the highest exit pages aren’t part of your main funnel and identifying them will give you an opportunity to optimize those pages and create connections from them to the main funnel.
As an example, we noticed that some of our most successful blog posts have a higher exit rate than others on mobile. To optimize this experience, we added a call to action prompting people to check out the next post or sign up to the newsletter.
We saw a big uplift in conversion rates and decreases in exit rate.
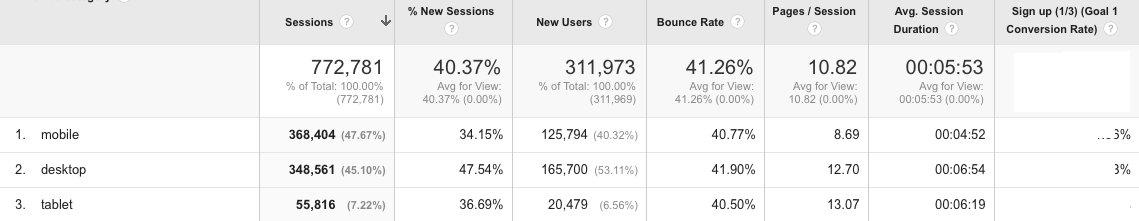
Device Report
Mobile visitors act differently than desktop visitors and have their own unique behaviors.
It is not an easy task to create an optimized experience for mobile visitors, but there are many ways you can better understand their behavior.
In order to deliver the best experience for your mobile visitors and identify which devices need more attention as well as which pages need to be optimized, you’ll need to use the device report in Google Analytics.
In the mobile overview report below, we can see that 47.57% of our customer’s traffic is via mobile. However, desktop visitors which account for the other half of traffic is generating almost double the conversions.
To further understand why this is, we need to start digging into the specific devices and identify the problem.
Digging deeper into the device report by navigating to Audience → Mobile → Devices, we noticed that certain screen resolutions were receiving traffic but brought 0 conversions.
Thanks to the report we were able to optimize those specific pages using custom Banana-splash calls-to-action and increased mobile conversion rates by over 100%.
Over to you
There are many reports to dig into and consider before starting an AB test.
The important part to remember is that it’s not enough to identify where the problem is, you must understand why it is occurring. Whether it is a technical issue or a strategic issue, do not base your AB tests on intuition alone.
There are many guides on how to better understand your customer’s needs and how to build a conversion optimization strategy you can learn from.
What are your go-to reports?